| Charting Excel has many charting capabilities to enhance your documents.
You can graphically display your worksheet data in a chart.
|
- Select the cells you want to make a chart with
- Click the Chart Wizard
 icon on the Standard Toolbar. A Chart Wizard box
will appear (Step 1). icon on the Standard Toolbar. A Chart Wizard box
will appear (Step 1).
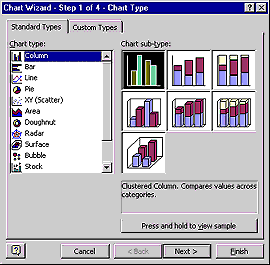
- Select from the Chart type list the type of
chart you want to create.
For each type there are also several subtypes to choose from.
|
 |
 |
- Click the Next button and the dialog box on the left will appear (Step
2).
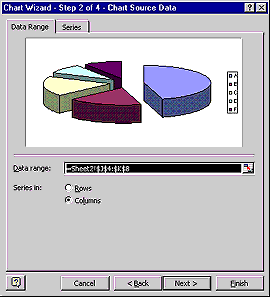
- Check the range shown in the Data Range box to verify that the range includes the cells
you want to chart.
|
- Click the Next button and the dialog box on the right will appear (Step
3).
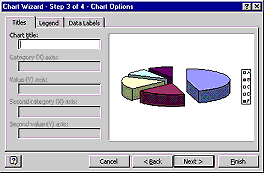
- Add any additional features to the chart by filling in the text boxes and setting
various option buttons.
|
 |
|
- Click the Next button and the final dialog box will appear (Step 4).
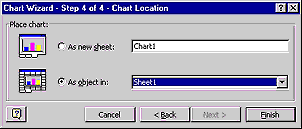
- Choose where you want the chart; in a new workbook or a current workbook. Click Finish.
|
- The chart is complete you can drag and resize it to fit in your document.
|
 |