Then the different exclusion probabilities can be written as follows:
1 INRA, Laboratoire de génétique et amélioration
des arbres forestiers,
2 INRA, Laboratoire de Biologie Evolutive,
*Corresponding author: Email: sophie.gerber@pierroton.inra.fr
Introduction
Parentage analysis has received increasing interest recently for tracing either pollen or seed flow in forest trees. The interest is also a consequence of the development of hypervariable codominant markers, such as microsatellites. In recent experimental data, it was shown that their level of diversity is so high that only a few loci (generally fewer than 10) are needed for assigning paternity in natural tree populations based on complete exclusion. However, the development of microsatellite loci is extremely costly and species specific. Hence, they could not be considered as an immediate tool for investigating parentage relationships in natural populations. On the other hand, the AFLP technology is not species specific, and could therefore be considered as an interesting alternative to microsatellites. However, AFLP markers are dominant, which is a major drawback for parentage analysis, unless a high number of loci are investigated. We report here on the comparison of microsatellites and AFLP markers for parentage analysis for case study in a mixed oak stand. Exclusion probabilities are calculated in each case, and likelihood methods are applied for assigning paternity (search for one parent) or paternity and maternity (search for both parents).
Methods
Comparison of exclusion probabilities between dominant and codominant markers
An exclusion probability can be defined as the average capability of any marker system to exclude any given relationship. It is conditioned by the genotypes of the reported relatives, by the frequency occurrence of alleles at the loci and by the number of independent loci tested (Jamieson and Taylor 1997). Three types of exclusion probabilities can be calculated. The most commonly used concerns paternity. The second concerns one single parent compared to an offspring (without any information on the other parent), and the third concerns a pair of potential parents compared to an offspring.
Codominant markers
Exclusion probabilities were computed for codominant markers (microsatellites) according to the formula given for instance in Jamieson and Taylor (1997).
For one locus with n different alleles, the ith allele
having frequency pi in the population, let ak
equal
![]() (1)
(1)
Then the different exclusion probabilities can be written as follows:
For dominant markers consider two phenotypes [+] and [-], i.e.,
presence
vs. absence of a given AFLP band. Let p be the frequency
of the presence of a given band. In a panmictic population, the frequency
of the [-] phenotype and of the [+] phenotype is (1-p)2 and
p(2-p),
respectively.
Case study
Calculation of exclusion probabilities was performed for a mature mixed oak stand (5.76 ha, 240m x 240m) comprising Quercus petraea and Quercus robur. The stand is located in northwestern France (part of the "Petite Charnie" forest (Streiff et al. 1999)). The mature trees (about 100-years old) originated from natural regeneration, and 89 of them were included in the present study. The 89 trees of the study have been genotyped for 6 microsatellite loci (ssrQpZAG104, ssrQpZAG9, ssrQpZAG1/5, ssrQpZAG36, MSQ4 and MSQ13) by Streiff et al. (1998). These loci were highly polymorphic and exhibited between 15 and 31 alleles per locus. The same 89 trees were genotyped for 214 AFLP bands using the following protocol. Primers were complementary to the adapters PstI and MseI, with one additional selective 3' nucleotide: C for PstI and either A or C or G for MseI. Among the detected bands, 159 were polymorphic, and there was about 3.6% missing data.
Results
We first computed the exclusion probabilities for 30 theoretical AFLP bands, with equal frequencies, between 0 and 1, for the "presence" allele of each band. The result is presented in Figure 1. The distribution of the 159 polymorphic AFLP bands of our sample according to their presence allele frequency is given in Figure 2. The corresponding cumulated exclusion probabilities (paternity and parent pair) are given in Figure 3. The cumulated exclusion probabilities (single parent, paternity and parent pair) for our 6 microsatellite loci, sorted by decreasing exclusion, are shown in Figure 4.
The exclusion probabilities for theoretical AFLP markers have their highest values for p (frequency of the presence allele) between 0.1 (paternity exclusion 0.87, pair exclusion 0.98) and 0.4 (paternity exclusion 0.80, pair exclusion 0.93). Among our 159 AFLP bands in our case study, 45 bands (28.3%) exhibited p values varying in this range. The exclusion probabilities calculated with these 45 bands can be compared to the one calculated with the 114 other bands and to those cumulated over the entire 159 bands (Table 1): the subset of 45 bands is almost as informative as the total set of bands. The different bands do not contribute equally to the total exclusion capacity.
The exclusion probabilities are high and quite similar for both types of markers (total paternity exclusion for AFLP: 0.996820 for microsatellites: 0.999910, pair exclusion for AFLP: 0.999959 for microsatellites: 1.000000), even if they are higher for microsatellites, and the single parent exclusion probability is only available for this type of markers (0.998233).
References
Jamieson A, Taylor SS (1997) Comparisons of three probability formulae for parentage exclusion. Animal Genetics 28: 397-400.
Streiff R, Labbe T, Bacilieri R, Steinkellner H, Glössl J, Kremer A (1998) Within-population genetic structure in Quercus robur L. and Quercus petraea (Matt.) Liebl. assessed with isozymes and microsatellites. Molecular Ecology 7: 317-328.
Streiff R, Ducousso A, Lexer C, Steinkellner H, Glössl J, Kremer A (1999) Pollen dispersal inferred from paternity analysis in a mixed stand of Quercus robur L. and Quercus petraea (Matt.) Liebl. Molecular Ecology 8: 831-841.
|
|
|
|
|
| Presence allele frequency range |
|
|
|
| Paternity exclusion probability |
|
|
|
| Pair exclusion probability |
|
|
0.999959 |
Table 1: Cumulated exclusion probabilities calculated on subsets of the 159 AFLP bands, according to the frequency range of the "presence" allele
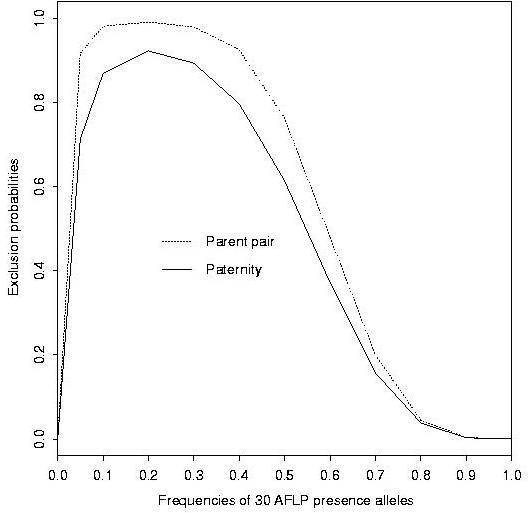
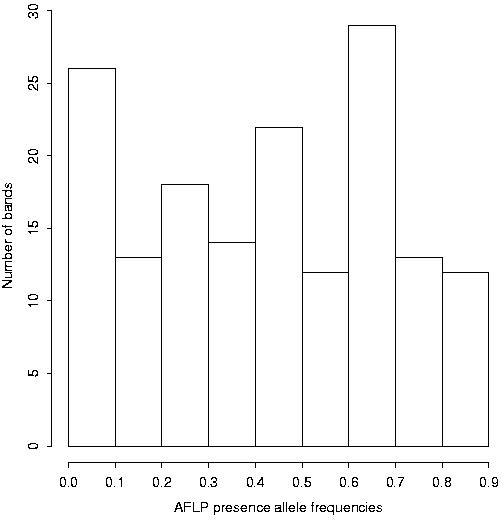
Figure 2: Histogram of the 159 AFLP bands according to the frequency
of the "presence" allele.
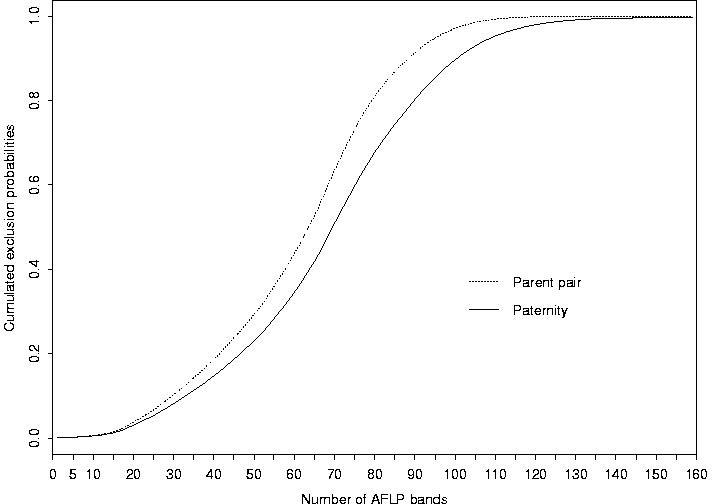
Figure 3: Cumulated exclusion probabilities (paternity and parent
pair) of the 159 AFLP bands.
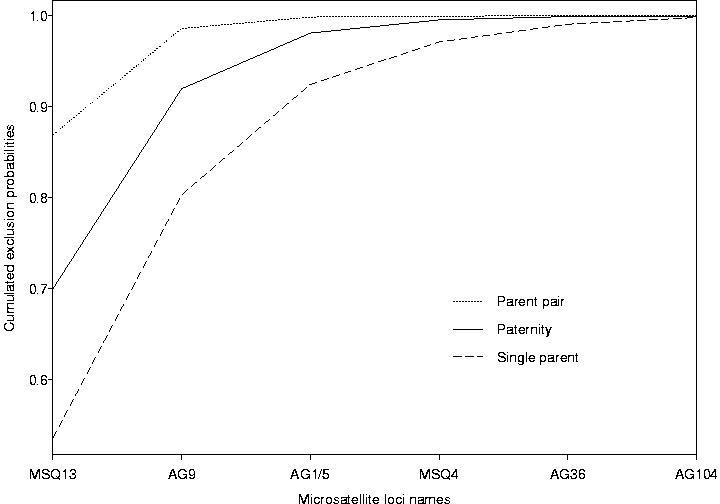
Figure 4: Cumulated exclusion probabilities (single parent, paternity and parent pair) of the 6 microsatellite loci.