|
|
|
| P R I N T E R - F R I E N D L Y F O R M A T | Return to Article |
D-Lib Magazine
July/August 2012
Volume 18, Number 7/8
Extraction and Visualization of Technical Trend Information from Research Papers and Patents
Satoshi Fukuda, Hidetsugu Nanba, Toshiyuki Takezawa
Hiroshima City University, Hiroshima, Japan
{fukuda, nanba, takezawa}@ls.info.hiroshima-cu.ac.jp
doi:10.1045/july2012-fukuda
Abstract
To a researcher in a field with high industrial relevance, retrieving and analyzing research papers and patents are important aspects of assessing the scope of the field. Knowledge of the history and effects of the elemental technologies is important for understanding trends. We propose a method for automatically creating a technical trend map from both research papers and patents by focusing on the elemental (underlying) technologies and their effects. We constructed a method that can be used in any research field. To investigate the effectiveness of our method, we conducted an experiment using the data in the NTCIR-8 Workshop Patent Mining Task. The results of our experiment showed recall and precision scores of 0.254 and 0.496, respectively, for the analysis of research papers, and recall and precision scores of 0.455 and 0.507, respectively, for the analysis of patents. Those results indicate that our method for mapping technical trends is both useful and sound.
Keywords: Information extraction, SVM, Domain adaptation, Measurement, Performance, Experimentation
1. Introduction
In this paper, we propose a method for creating a technical trend map automatically from both research papers and patents. This map will enable users to grasp the outline of technical trends in a particular field. For a researcher in a field with high industrial relevance, retrieving and analyzing research papers and patents is important for assessing the scope of the field. In addition, research paper searches and patent searches are required by examiners in government patent offices, and by the intellectual property divisions of private companies. An example is the execution of an invalidity search through existing patents and research papers, which could invalidate a rival company's patents, or patents pending in a patent office. However, it is costly and time-consuming to collect and read all of the papers in the field. There is a need for automatic analysis of technical trends.
For the construction of the technical trend maps, we focused on the elemental (underlying) technologies and their effects. Knowledge of the history and effects of the elemental technologies is essential for analyzing technical trends. We constructed a system that can be used in any field of research.
The remainder of this paper is organized as follows: section 2 shows the system behavior in terms of snapshots; section 3 describes related work; section 4 explains our method for analyzing the structure of research papers and patents; and section 5 reports on these experiments and discusses the results. We present some conclusions in section 6.
2. System Behavior
Our system visualizes technical trends. Figure 1 shows a technical trend map for the "image recognition" field. In this figure, several elemental technologies used in the image recognition field, such as "FPGA (Field Programmable Gate Array)" are listed in the left-hand column. The effects of each technology, such as "約33%と著しい速度向上 (remarkable speed improvement of about 33%)", are shown in the right-hand column. These technologies and effects were extracted automatically from research papers and patents in this field, and each research paper and patent is shown as a dot in the figure. The x-axis indicates the publication years for the research papers and patents. Moving the cursor over a dot causes bibliographic information about the research paper or the patent to be shown in a pop-up window.
If the user clicks on an elemental technology in the figure, a list of research fields in which that technology has been used is shown. For example, if the user clicks on "FPGA" in Figure 1, a list of research fields for which "FPGA" is an elemental technology is displayed, as shown in Figure 2. From this list, we discover that "FPGA" was used in the electronic device field (integrated circuit for pattern recognition) in 1998 and that this technology was used in the information and communications engineering field (speech analysis system) in 2005.
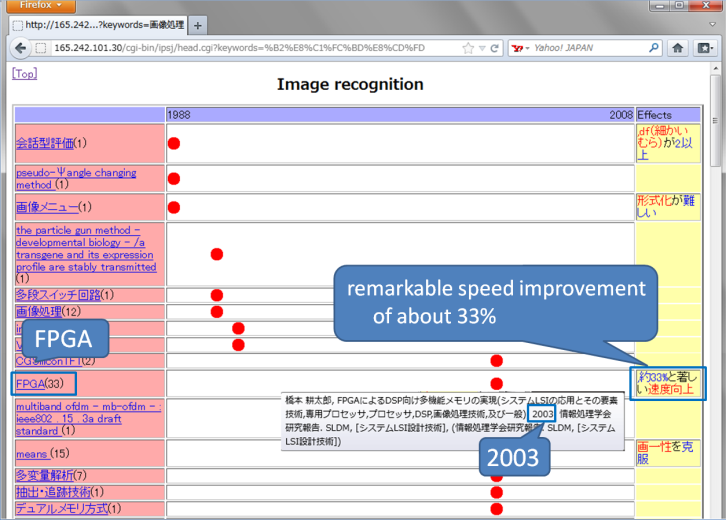
Figure 1. A list of elemental technologies used in the "Image recognition" field
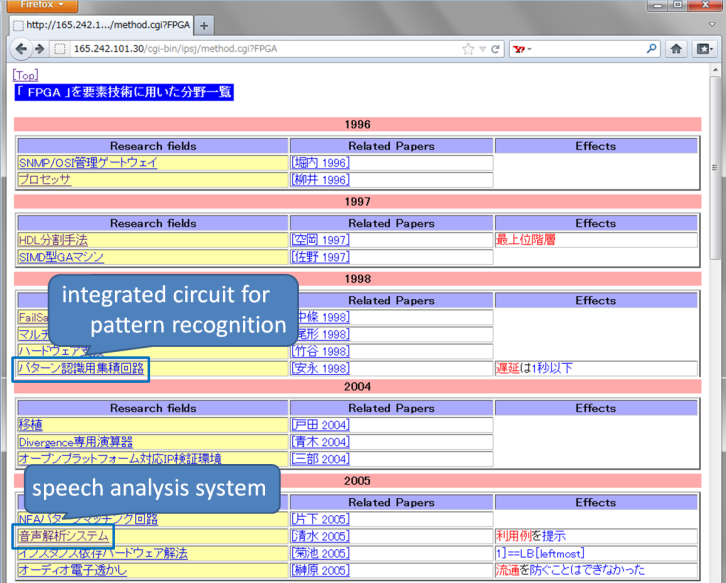
Figure 2. A list of research fields that use "FPGA" as an elemental technology
3. Related Work
The interest in systems that analyze technical trends is very great. Kondo et al. [2] proposed a method that analyzes the structure of research paper titles using a machine-learning-based information extraction technique. They extracted elemental technologies from research paper titles in a particular field, and created a technical trend map by showing a history of those elemental technologies in the field.
The NTCIR-8 Patent Mining Task [3] is another research project which aims to create technical trend maps from research papers and patents. Creating a technical trend map is a two-step process. First, research papers and patents are collected for a given field. Then, elemental technologies and their effects are extracted from the documents collected in step 1, and the documents are classified in terms of the elemental technologies and their effects. For both steps, two subtasks are conducted: Research Paper Classification classifies research papers into the IPC system (a global standard hierarchical patent classification system) and Technical Trend Map Creation extracts the expression of elemental technologies and their effects from research papers and patents.
We evaluated our method using the dataset used for the subtask of Technical Trend Map Creation. We used Nanba's approach [4] for the basic framework of the Technical Trend Map Creation subtask. Nanba et al. were one of participant groups in this subtask, and employed machine learning with several features based on cue phrases, which we will describe in section 4.2. Although they obtained the best performance of all the participating groups, the recall score was low due to the lack of cue phrases and the insufficiency of training data.
We improved the recall score using two methods: (a) using a unit list as an additional feature for machine learning, and (b) applying domain adaptation techniques. Nishiyama et al. [5] also used a domain adaptation technique, FEDA [1], for the subtask of Technical Trend Map Creation, and reported its effects. We also examined FEDA, and confirm its effectiveness. In addition to FEDA, we propose some domain adaptation methods, and show that our methods are superior to FEDA.
4. Automatic Creation of the Technical Trend Map
4.1 Task Definition
To create a technical trend map, such as those shown in Figures 1 and 2, we extracted elemental technologies and their effects from research papers and patents using information extraction based on machine learning. We formulated the information extraction as a sequence-labeling problem, then analyzed and solved it using machine learning. The tag set is defined as follows:
- TECHNOLOGY includes algorithms, materials, tools, and data used in each study or invention.
- EFFECT includes pairs of ATTRIBUTE and VALUE tags.
- ATTRIBUTE and VALUE include effects of a technology that can be expressed by a pair comprising an attribute and a value.
A tagged example is given below in Figure 3.
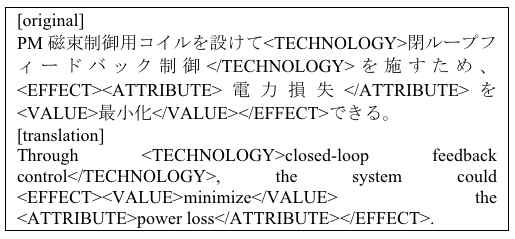
Figure 3. A tagged example
4.2 Strategies for Extraction of Elemental Technologies and Their Effects
We used Nanba's approach [4] as a basic framework for extracting the elemental technologies and their effects. As for the machine learning method used, Nanba investigated the Support Vector Machine (SVM) approach, which obtained higher precision than the Conditional Random Field (CRF) via pilot studies. The SVM-based method identifies the class (tag) of each word. The features and tags given by the SVM method are shown in Figure 4, and are described below. The phrases of the technologies, effect attributes, and effect values are encoded in the IOB2 representation [6]. The bracketed numbers shown for each feature represent the number of cue phrases. They used window sizes k=3 and k=4 for research papers and patents, respectively, which were determined via a pilot study.
- A word.
- Its part of speech.
- ATTRIBUTE-internal (F1): Whether the word is frequently used in ATTRIBUTE tags; e.g., "精度(precision)". [1210]
- EFFECT-external (F2): Whether the word is frequently used before, or after the EFFECT tags; e.g., "できる(possible)". [21]
- TECHNOLOGY-external (F3): Whether the word is frequently used before, or after the TECHNOLOGY tags; e.g., "を用いた(using)". [45]
- TECHNOLOGY-internal (F4): Whether the word is frequently used in TECHNOLOGY tags; e.g., "HMM" and "SVM". [17]
- VALUE-internal (F5): Whether the word is frequently used in VALUE tags; e.g., "増加(increase)". [408]
- Location (F6): Whether the word is contained in the first, the middle, or the last third of an abstract.
In addition to these features, we examine a unit list as another feature, "F7", for machine learning. We will describe the details of this feature in the next section.
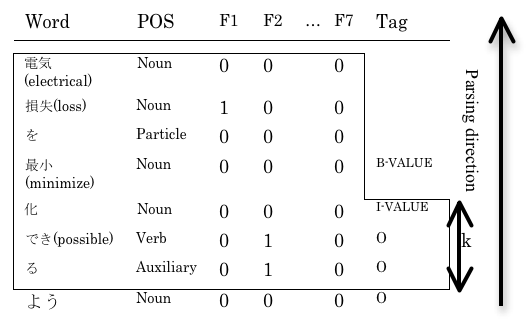
Figure 4. Features and tags given to the SVM
4.3 Creation of a Unit List
We created a unit list for VALUE tag annotation semi-automatically. Most nouns (counter suffix) immediately after numerical values, such as "100 cm" or "20 MB/s", are considered units. Therefore, we collected these nouns from the CiNii research paper corpus automatically, then manually created a unit list from them. Finally, we obtained 274 unit terms, some of which are shown in Figure 5.
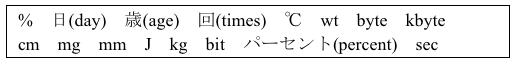
Figure 5. An example of a sorted unit term list
4.4 Domain Adaptation
In the Technical Trend Map Creation subtask, 300 research papers and 300 patents with manually assigned "TECHNOLOGY", "EFFECT", "ATTRIBUTE", and "VALUE" tags were prepared. For extracting elemental technologies and their effects from research papers, Nanba et al. [4] used 300 research papers as the training data, while Nishiyama et al. [5] used 300 research papers and 300 patents by introducing a domain adaptation method, FEDA [1], and reported on the effectiveness. FEDA is a feature augmentation technique that simply adds features for the source and target domains to the original feature list. The augmented feature vector for the paper domain is fpaper(x)=<f(x), f(x), 0 and that for the patent domain is fpatent(x)=<f(x), 0, f(x)> where 0=<0, 0, ..., 0>∈Rm is the zero vector. Then, this augmented data in both domains is used for predictive modeling, and the weights of the shared features are estimated using the training data from both domains. We also examine FEDA, and confirmed its effectiveness.
In addition to FEDA, we propose the following:
Method 1: SEQ
- Obtain model A using 300 research papers as training data.
- Obtain model B using 300 patents as training data.
- Annotate research papers with tags obtained from model A, then annotate the papers with additional tags obtained from model B.
Generally, elemental technologies are written descriptively in patents. As a result, the average length of "TECHNOLOGY" tags in patents is much greater than that of research papers. This indicates that model B tends to annotate longer "TECHNOLOGY" tags, even though the target documents are research papers. To improve this problem, we propose another method:
Method 2: SEQ(T)
- Obtain model A using 300 research papers for training data.
- Obtain model B' using 300 patents, whose "TECHNOLOGY" tags were preliminarily removed for training data. In this step, features F3 and F4 are not used.
- Annotate research papers with tags obtained from model A, then annotate the papers with additional tags obtained from model B'.
For patent analysis, models B or B' are first applied to patents in step 3.
5. Experiments
To investigate the effectiveness of our method, we conducted some experiments. We describe the methods and the results in Sections 5.1 and 5.2, respectively.
5.1 Experiment Methods
Datasets and settings
We used the data for the Technical Trend Map Creation subtask of the patent mining task from the NTCIR-8 Workshop [3]. In this subtask, sets of the following documents with manually assigned "TECHNOLOGY", "EFFECT", "ATTRIBUTE", and "VALUE" tags were prepared. Included were 500 Japanese research papers (abstracts) and 500 Japanese patents (abstracts). For each type of document, 300 were provided as training data, with the remaining 200 being used as test data in the Patent Mining Task.
Evaluation
We used the following measures for evaluation.
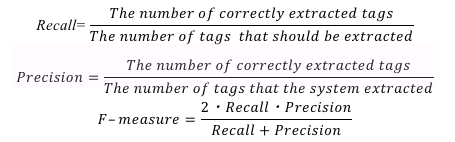
Alternative methods
We conducted experiments using the following methods.
Baseline Methods:
- HCU [4]: An SVM-based approach using eight features (word, its part of speech, and features F1 to F6).
- TRL_7_1 & TRL_6_2 [5]: A CRF-based approach using several features (word, its part of speech, character type, word prefix type, sections in patents, relative position in research papers, IPC codes manually assigned to each abstract, evaluative phrase, phrase distance in dependency trees) along with domain adaptation technique FEDA [1].
Our Methods:
- UNIT: An SVM-based approach using features F1 to F7.
- UNIT_FEDA: An SVM-based approach using features F1 to F7. Both research papers and patents are used as training data by applying FEDA.
- SEQ: An SVM-based approach using features F1 to F7. (Method 1 in section 4.4).
- SEQ(T): An SVM-based approach using features F1, F2, F5, F6, and F7. (Method 2 in section 4.4).
5.2 Experiment Results
The average scores of recall, precision, and F-measure for the analysis of research papers and patents are shown in Tables 1 and 2, respectively. As can be seen from Table 1, our method SEQ(T) significantly improved recall scores compared with the baseline methods used in research paper analysis. On the other hand, our methods did not improve on the baseline methods in patent analysis (Table 2), because the performance of the baseline system is so high there was little room for improvement.
Table 1: Experimental results for research papers |
Table 2: Experimental results for patents |
5.3 Discussion
Effectiveness of domain adaptation and a unit list
To investigate the effects of a unit list and domain adaptation methods, we calculated recall, precision, and F-measure of methods HCU, UNIT, and SEQ(T) for each tag. We found that recall scores of UNIT for ATTRIBUTE and VALUE were 1.3 to 1.7% higher than those of HCU. Recall scores of SEQ(T) for ATTRIBUTE and VALUE were 12.8 to 13.6% higher than those of HCU. These results indicate that a unit list is useful, but the contribution by our domain adaptation method is much greater than a unit list.
Comparison of domain adaptation methods
The recall score of UNIT_FEDA is higher than that of UNIT, and we could also confirm the effectiveness of FEDA, even though the features used in our method differ from those in Nishiyama's method. However, we can conclude that our domain adaptation methods (SEQ(T) and SEQ) are more useful than FEDA in research paper analysis.
6. Conclusions
In this paper, we describe a method that extracts elemental technologies and their effects from the abstracts of research papers and patents. From our experimental results, our method SEQ(T) obtained recall and precision scores of 0.254 and 0.496 respectively, for the analysis of research papers. The SEQ(T) method also obtained recall and precision scores of 0.455 and 0.507 respectively, for the analysis of patents. Therefore, we have constructed a system that creates an effective technical trend map for a given field.
7. References
[1] Daumé, III. 2007. Frustratingly easy domain adaptation. In Proceedings of the 45th Annual Meeting of the Association for Computational Linguistics, 256—263.
[2] Kondo, T., Nanba, H., Takezawa, T., and Okumura, M. 2009. Technical trend analysis by analyzing research papers' titles. In Proceedings of the 4th Language & Technology Conference (LTC'09), 234—238.
[3] Nanba, H., Fujii, A., Iwayama, M., and Hashimoto, T. 2010. Overview of the patent mining task at the NTCIR-8 workshop. In Proceedings of the 8th NTCIR Workshop Meeting.
[4] Nanba, H., Kondo, T., and Takezawa, T. 2010. Automatic creation of a technical trend map from research papers and patents. In Proceedings of the 3rd International CIKM Workshop on Patent Information Retrieval (PalR'10), 11—15.
[5] Nishiyama, R., Tsuboi, Y., Unno, Y., and Takeuchi, H. 2010. Feature-rich information extraction for the technical trend map creation. In Proceedings of the 8th NTCIR Workshop Meeting.
[6] Tjong Kim Sang, E.F. and Veenstra, J. 1999. Representing text chunks. In Proceedings of the 9th Conference on European Chapter of the Association for Computational Linguistics (EACL), 173—179.
About the Authors
 |
Satoshi Fukuda is a master's degree student at the Graduate School of Information Sciences, Hiroshima City University. He graduated from the Faculty of Information Sciences, Hiroshima City University in 2010. |
 |
Hidetsugu Nanba is an Associate Professor at the Graduate School of Information Sciences, Hiroshima City University. He received his M.S. and Ph.D. (Information Science) from Japan Advanced Institute of Science and Technology in 1998 and 2001, respectively. He was a JSPS research fellow in 2001, and he was a research associate at Precision and Intelligence Laboratory, Tokyo Institute of Technology in 2002. His research interests include natural language processing and information retrieval. |
 |
Toshiyuki Takezawa is a Professor at the Graduate School of Information Sciences, Hiroshima City University. He received his B.E., M.E., and D.Eng. degrees from Waseda University in 1984, 1986, and 1989. In 1987, he became a research associate at the Centre for Informatics, Waseda University. In 1989, he joined ATR Interpreting Telephony Research Laboratories. His research interests include natural language processing, speech recognition, translation and dialogue systems. |
|
|
|
| P R I N T E R - F R I E N D L Y F O R M A T | Return to Article |