LIBRES:
Library and Information Science Research
Electronic Journal ISSN 1058-6768
2000 Volume 10 Issue 2; September 30
Bi-annual LIBRES 10N2
Modular Bibliometric
Information System with Proprietary Software (MOBIS-ProSoft): a versatile approach
to bibliometric research tools.
Gilberto R,
Sotolongo-Aguilar *, Carlos A. Suárez-Balseiro **, Maria V. Guzmán-Sánchez *
* The Finlay
Institute; POBox 16017, Cod. 11600 La Habana, CUBA. E-mail: finlayci@infomed.sld.cu
** Faculty of Communication, University of Havana Calle G, No.506, Vedado, La Habana 10600, La Habana, CUBA. E-mail: csbgv@bib.uc3m.es
Abstract
This paper presents a platform outline for bibliometric
research. Conceived as a modular system it is based on proprietary software.
This proposal intends to show a low complexity framework software which is
reasonably widely available including artificial neural networking software.
This approach works smoothly with small and medium size corpora and may be very
useful for both research and educational purposes.
Introduction
One of the
challenges today for information professionals is to guide the way through huge
volumes of information generated by different means. The birth and development
of new disciplines such as “data mining” and “knowledge discovery”, shows the
increasing importance of quantitative and qualitative analysis of huge corpora
data (Dhar and Stein, 1997; Swanson and Smalheiser, 1997).
Bearing this in
mind, bibliometric research becomes one of the fundamental tools used by
information professionals in their quest of indicators; allowing them “critical
appraisals” of scientific research, as well as interaction among researchers,
institutions and knowledge areas.
The above reasons
have conditioned increasing efforts for the systematization and standardization
of methods and tools used in bibliometric research. Classical studies have
supported the importance of clearly defining the problems in the field,
emphasising the application of statistics as a key factor in discovering new
knowledge (Egghe and Rousseau, 1990). For Glanzel (1996), bibliometrics is a
complex discipline which, although it
may be classified as a social science, is closely conditioned by pure
and technological sciences. Therefore any methodological characterization
requires well-documented data processing methods, a clear description of the
sources and exact definition of indicators and, on the other hand, there is a need
for an effective selection and integration of the applied technologies.
Ravichandra Rao (1996) asserts that no bibliometric technique alone can be
applied to all research, but instead different procedures should be used for
different problems. Grivel, Polanco and Kaplan (1997) emphasize what they
call “informatic infrastructure” where
bibliometrics could develop all its potential. According to these authors,
bibliometrics should have a methodology characterized by not only an adequate
mathematical representation but also an effective “informatic architecture”.
Therefore
bibliometric information systems are the workbench of bibliometric research.
Being an important part of this field
of endeavor, they require a flexible design in order to obtain accurate and
customized indicators and should integrate new features resulting from the
latest developments.
Many colleagues have found
their way into bibliometrics by building in-house applications. At the end of
the 80’s Terrence Brooks prepared a set of computer programs written in Turbo
Pascal called the Bibliometrics Toolbox in order to measure the bibliometric
aspects of a literature (Brooks, 1987; McLain, 1990). For Van Raan (1996) in
Leiden the chosen name was “The Machine”; in CRRM they use a software suite,
with DATAVIEW (Rostaing et al., 1996) as flagship, and the CUIB-METRIC system
is proposed by specialists at the UNAM in Mexico (Portal and Thompson, 1994).
There is the application of TOAK -Technology Opportunity Analysis Knowbot - at
the Technology Policy & Assessment Center, at Georgia Institute of
Technology, in Atlanta, USA (Porter and Detampel, 1995) and HENOCH (Grivel et
al., 1997), and NEURODOC (Polanco et al., 1998) which are used at INIST in
France. Bibexcel (Bibmap before Excel), developed by Professor Olle Persson,
from Inforsk, Umeå University in Sweden, and BibTechMon (Kopcsa and Schiebel,
1998) are other available approaches. The work of Katz and Hicks (1997), Small
(1998), and White and McCain (1998) takes the same direction. Finally we have
to mention the experiences of Chen (1995), Lin (1995, 1997), and Orwing, Chen
and Nunamaker (1997) in the application of artificial neural networks for
bibliometric purposes based on the Kohonen’s self-organizing map (SOM), which is an orderly mapping of a high-dimensional,
eventually structured distribution of data onto a regular low-dimensional grid.
The Kohonen´s SOM is probably the best know network model geared towards
unsupervised training and essentially consists of a regular grid of processing
units or “neurons” associated with a model of some multidimensional observation
to represent all the available observations with optimal accuracy, using a
restricted set of models ordered on the grid so that similar models are close
to each other and dissimilar models far from each other (Kohonen, et al., 1999; Kohonen, 1998).
However the problem arises
of when generalization should be done.
In-house applications are rarely well documented and their use by others
becomes difficult. The result is that only the members of the team are able to
replicate the use of such applications.
The standardization fails and it is not only a handicap for practical
research; it becomes a barrier for
teaching purposes because many educational institutions are not be able to
obtain and implement in-house applications to support bibliometric educational
programs.
This problem may be overcome
in part using a set of proprietary software, which is well-documented, widely
available and more accessible than in-house applications. On the other hand,
the validation of techniques is obvious and many teams of developers are
continuously improving the performance of such software.
This paper
describes a methodology based on the utilization of a set of proprietary
software working together in order to perform bibliometric analysis of a
literature. This methodology is explained as an open and flexible bibliometric
information system in compliance with a simple modular design and connectivity
for desktop work. It is useful for practical work as well as for education and
training purposes. We envisage our task as seeking the integration of different
available software with the objectives of consolidating an informatic
infrastructure for our bibliometric research and developing standard methods
that fit with this purpose.
Methodology
Our approach
consists of five modules based on proprietary software integrating the system.
The modules perform the following functions:
(1)
Bibliographic
Searches
(2)
File Conversion
& Handling
(3)
Bibliographic
Reference Management
(4)
Indicators
including (experimental) Artificial Neural networking
(5)
Bibliometric
Analysis
Bibliographic
Searches are conducted online or on CD-ROM.
Resulting files are downloaded and converted by module (2) File
Conversion & Handling. Resulting files are the input to module (3)
Bibliographic Reference Management, where the standardization of the database
is performed. Different fields under study or a combination of them are
exported and saved as text files. Afterwards, those files are processed in
module (4) Indicators. In this module
several statistical analysis may be carried out to obtain the inputs for the bibliometric analysis in the module
5. Different scenarios could be
implemented, varying the elements
inside each module.
In our experience, for small and medium size corpora,
the following packages appear to work very
well:
1.
Bibliographic Searches.
Dependent on the topic of research e.g. in biomedicine SPIRS, WINSPIRS, both
from Silver Platter, PubMed and Internet GratefulMed or The Query E-mail Retrieval System from NLM.
2. File
Conversion & Handling.
Resulting files are downloaded and treated by BiblioLink™ converting them according to a selected configuration that depends
on host and fields to be studied. BiblioLinkä
convert the files to Prociteä
format.
3.
Bibliographic Reference Manager.
Procite™ (Research Information Systems Inc.), works very well for the managing
of bibliographic references allowing standardization of data. Furthermore
BiblioLinkä
and Prociteä
are totally integrated in their latest versions.
4.
Indicators
(obtained in this module). The functions of this module are performed by
different statistical packages, e.g. Excel™ (Microsoft Corp.) and its
complement xlStat™ (Stat@Com Inc.) and STATISTICA® (StatSoft Inc.). The former
gives the possibility of profiting from all the built-in features of this
program including graph and functions features. We have recently introduced an
experimental submodule for Artificial Neural Networking. We used Viscovery ®
SoMine from Eudaptics Software Gmbh for this purpose, allowing us to work
without models and statistical assumptions by using the powerful Self-Organizing
Maps (SOM) Technology. It leads to a very good representation of
high-dimensional data by maintaining similarities implicit in the data.
5.
Bibliometric analysis.
Finally in this module the analysis of indicators is performed according to the
aims of the particular task undertaken.
Results & Discussion
The above
mentioned scenario operates according to the following procedure: bibliographic
searches are conducted online or on CD-ROM. Resulting files are downloaded and
treated by BiblioLink™ converting them according to a selected configuration
that depends on host and fields to be studied. The resulting converted file is
already in Procite™ format having the possibility to switch directly to the
bibliographic reference management features of Procite™. Here standardization
of the database is conducted. Many different treatments could take place
including the building of authority lists with the contents of different fields
including an authority list of all words in any field or in the whole database.
The different fields under study or a combination of them are exported and
saved as text files. Afterwards, Excel™ imports those files. Frequency analysis
may then be performed aided by the Pivot Table feature of Excel™ complemented by
built-in Analysis Functions available in the Tools Menu. With Excel™, using
xlStat™ it is also possible to build
the matrices that produce the input for cluster analysis, factor analysis, PCA,
and multidimensional scaling and
undertake these analysis. Alternatively, those matrices may be exported as
Excel™ sheets and imported into STATISTICA® (StatSoft Inc.) and finally
processed. More recently we have been experimenting with Viscovery SoMine.
Beyond its visual exploration capabilities, Viscovery® also supports in-depth
statistical analysis of data. The combination of the non-linear data
representation of the SOM approach with classical statistical methods - such as
regressions or principal component analysis (PCA) - results in the improvement
of the final model in terms of precision
and efficiency.
This system
platform guarantees a comprehensive traceability of all data from the first
data downloaded, to the last chart obtained. At the same time, consistent
results are attained by means of the reproducibility at all the steps
performed. Bibliographic data in the database could also be used for
building-up formatted bibliographies.
This approach has
been applied in different studies (Macías-Chapula et al., 1999; Guzmán-Sánchez
et al., 1998; Sanz-Casado, et al., 1998) mainly focused on the biomedicine
field and more specifically in the area of vaccines research. However, other
domains such as library and information science or economics have been explored
(Sanz-Casado et al., 1999; Sotolongo-Aguilar, 1999)[1].
Bibliometric output data of the system could perform, among others, the
following activity and relations measurements:
1.
Counts of papers
by the following fields or a combination of them:
·
Authors
·
Sources
·
Keywords (e.g.
MESH)
·
Years
·
Substances
·
Documents types
·
Languages
·
Affiliation
·
Country of
publication
·
Authors/papers
·
Substances/papers
·
Keywords/papers
·
Document
types/papers
2.
Co-occurrence
matrices for multivariate analysis of the following fields or a combination of
them:
·
Authors
·
Keywords
·
Substances
·
Document types
·
Self-Organized-Maps
for spatial representation of linear or multidimensional data
For
bibliographic searches in biomedicine we have been using The Query E-mail Retrieval System from
NLM. This is a very nice retrieval engine by e-mail and works very well. In the
case of the bibliographic reference management software, we have extensively
used Procite™ beginning with version 2.02 (MS DOS) up to the latest available
5.0 (for Windows). The advantage of the latter is that it integrates its
companion file-conversion software BiblioLink™. It also works very smoothly.
Other reference management software has been tested e.g. EndNote™ and Reference
Manager™ including the latest versions. There are nearly 40 reference management software packages on the market
eligible for these tasks. Statistical packages are another important component.
Undoubtedly EXCEL® is widely used and complies very well with many bibliometric
tasks. A very good complement to EXCEL® , as already mentioned, is xlStat™ with
many useful features for building matrices, cluster analysis, factor analysis
and PCA, and multidimensional scaling. Finally the above mentioned Viscovery®
SoMine (Eudaptics Software Gmbh 1999) seems to be a very powerful application;
it is based on the concept of Self-Organizing Maps (SOM) which is a
particularly robust form of unsupervised neural networks. Teuvo Kohonen first
introduced the SOM method which can be viewed as a non-parametric regression
technique that converts multi-dimensional data spaces into lower dimensional
abstractions. Much as a regression plane is an abstraction of the original
data, Viscovery® SoMine generates a representation of the data distribution,
with the difference that this representation is non-linear. Inside Viscovery, a
two-dimensional hexagonal grid realizes the SOM. Starting from a set of
numerical, multivariate data records, the "nodes" on the grid
gradually adapt themselves to the intrinsic shape of the data distribution.
Since the order on the grid reflects the neighborhood within the data,
attributes and features of the data distribution can be read off from the
emerging "landscape" on the grid. The resulting "map"
contains the representation of the original data distribution. In a second step,
this data representation is systematically converted to visual information in
order to enable the application of a number of evaluation techniques. By means
of a new network scaling method the learning process has been improved
significantly. For illustrations see the Appendix.
Conclusions
The benefits
resulting from the developments outlined in this paper could be threefold.
Besides integrating public domain software in a flexible modular design,
comprehensive automated processing and data representation stages of research could
be achieved in contrast to the cumbersome tasks that are performed by other means. This platform is supported on
software which is widely used and
regularly updated and upgraded; in contrast with adhoc software that becomes
outdated very rapidly.
Last but not
least, teaching bibliometric research seems to benefit from this approach,
bearing in mind its use of proprietary software available world wide, regularly
updated and supported by well established developing teams. Improved
bibliometric research practices must be supported by theoretical and practical
education in which technologies have a key role. However, if the methods and
tools used are not widely accessible and it is necessary to depend on an
in-house application, the experience could be frustrating.
Finally we have to emphasise
the fact that MOBIS-ProSoft is not new software, it is not a new in-house
developed application; it is a methodological approach using a set of different
proprietary applications working in modules.
This methodology has been shown to be a working platform that could be
up-graded, is flexible and has utility performance. Moreover it is a practical
alternative for educators to improve their teaching programs. Improvements to
MOBIS-ProSoft are foreseen. Participation in the testing of this methodology is
welcome, as well as new ideas for incorporating modules or improving the
existing system.
Appendix
This appendix
contains figures illustrating some features of
the MOBIS-ProSoft (modular
bibliometrics information system with proprietary software) approach.
Figure 1. Matrix-building module showing
(partially): raw data (upper-half); frequency of ocurrence (lower half – left);
coocurrence matrix (lower half – right)
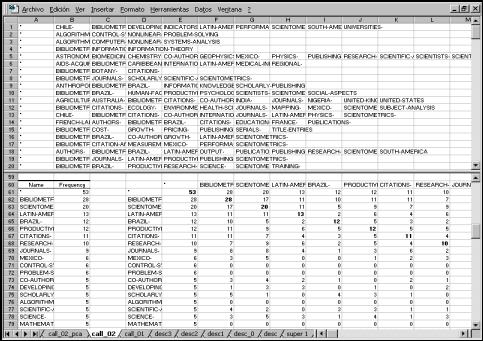
One of the most
interesting features of using the MOBIS-ProSoft approach, is the
matrix-builder feature implemented by running biblio.xla module under xlStat™.
A selected multiword field of the database, for instance the Subject field or
the Author field, is exported as comma delimited text and after it is imported
into Excel™. Then the biblio.xla module can be run. The resulting Excel™ sheet of the current workbook looks like the
upper half of figure 1. Column A is manually added for assuring that all elements
will be included in the matrix-building process. The results of running
biblio.xla appears in the lower half of figure 1; at the left the frequency
table is built up; after skipping one column the symmetric coocurrence matrix
appears at the right. The square matrix can have a maximum size of 252 x 252. In the illustration is a data set
from ISA (1966-1998) descriptors related to Library & Information Science
Research Methods in Latin America & the Caribbean.
Figure
2. Dendogram resulting from clustering using the Ward method including clusters
observation / clusters size
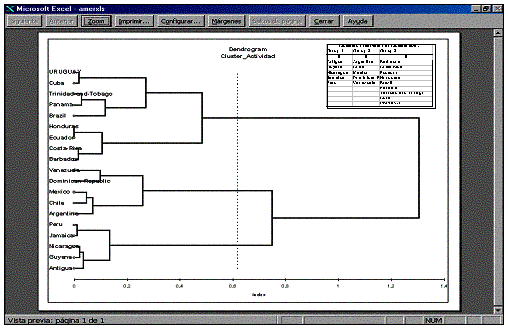
This illustration shows the
results of clustering similarities e.g.
Pearson Product Moment rp,
using the Ward method. In this case country clustering according to the
Activity Index from ISA (1966-1998)
Library & Information Science in Latin America & the Caribbean.
The illustration includes the Clusters Observation / Clusters Size for the best
partition suggested by running the results i.e. three groups of size 5, 5 and
9, with the corresponding country names by group.
Figure 3.
Map based on principal component
analysis with Varimax transformation
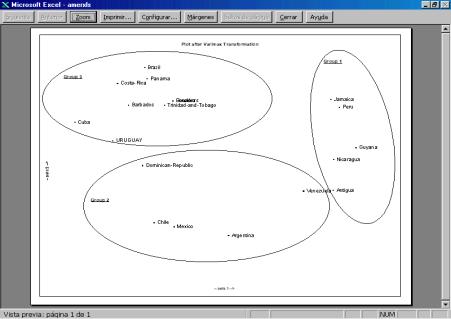
This illustration
shows the map corresponding to the same data set used in figure 2. In this case
the display is a PCA map with Varimax transformation. The groups founded in the
clustering procedure shown in figure 2 are highlighted.
Figure
4. Map based on multidimentional
scaling
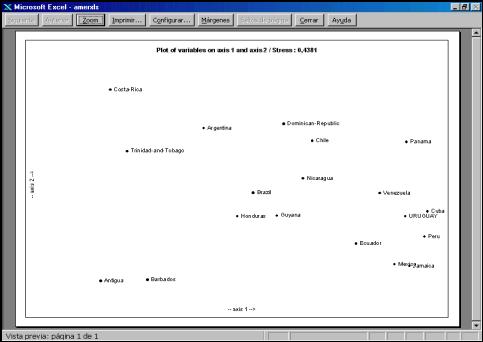
Figure 4
shows an MDS map which displays
another view of the data set used in figures 2 and 3. In this case
dissimilarities were calculated as 1- rp.
Figure 5.
Self Organized Map (SOM) and windows of map-layers & values based on
an Artificial Neural Network (ANN) trained with Kohonen unsupervised algorithm.
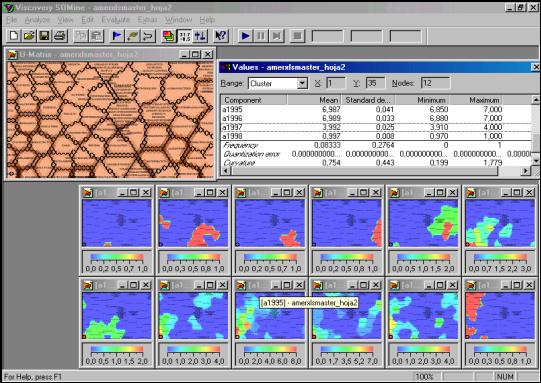
The most
intriguing feature recently incorporated on an experimental basis to the
MOBIS-ProSoft approach is the SOM-ANN. Again, as in figure 1, a data set from
ISA (1966-1998) descriptors related to Library & Information Science
Research Methods in Latin America & the Caribbean is used, in this case
time series of descriptor occurrence for the years 1983-1984,1986, 1990-1998.
Viscovery® SoMine was used for training the network based on 133 data records
from same number of descriptors characterized by 12 components (dimensions or features). Forty four cycles
in normal exact mode of training were needed
for generating a map size of 100:61 with 1905 nodes that represent the
trained network . Figure 5 shows a
screenshot with some results. In the upper-left part of the screenshot is
a map showing the clusters formed, at
the upper-right the values of some of the year component of the cluster
corresponding to bibliometrics that is located in the lower-left corner of the
cluster map. The rest are all the map-layers corresponding to all the
dimensions (one for each displayed from left-right top-bottom. A different tone of gray (different colors in the
original) shows different “landscapes” views. The first year of the time series
(left map in the first row of maps-layers) displays isolated spots of activity,
while as time goes by (second row of maps-layers) the activity increases and
non-linear correlation could be observed. Resulting data from the trained network
could later be evaluated.
References
Brooks, T (1987). The Bibliometrics Toolbox, version 2.8. North City Bibliometrics. Available at: ftp.u.washington.edu/public/tabrooks/toolbox/
Chen, H. (1995). Machine Learning for Information Retrieval: neural networks, symbolic learning, and genetic algorithms. Journal of the American Society of Information Science 46(3), 194-216
Dhar, V. and Stein, R. (1997). Seven Methods for Transforming Corporate Data into Business Intelligence. Prentice Hall.
Egghe, L. and Rousseau, R. (1990). Introduction to Informetrics. Quantitative Methods in Library Documentation and Information Science. Netherdlands: Elsevier Sciences Publisher.
Eudaptics Software Gmbh. (1999). Viscovery® for CRM-applications (Viscovery White Paper). Available from: http://www.eudatic.com/
Glanzel, W. (1996). The need for standards in bibliometric research and technology. Scientometrics 35(2), 167-176.
Grivel, L., Polanco, X. and Kaplan, A. (1997). A computer system for
big scientometrics at the age of the worldwide web. Scientometrics,
40(3), 493-506.
Guzmán-Sanchez, M.V., Sánz-Casado, E. and Sotolongo-Aguilar, G. (1998). Bibliometric study on vaccines (1990-1995) in Iberian-American countries. Scientometrics 43(2), 189-205 .
Katz, J.S. and Hicks, D. (1997). Desktop Scientometrics. Scientometrics 38(1),141-153.
Kohonen, T.,
Kaski, S., Lagus, K., Salojärvi, J., Honkela, J., Paatero, V., and Saarela, A.
(1999). Self-Organization of a massive text document collection. In: Oja, E.
and Kaski, S. editors. Kohonen Maps.
Amsterdam, Elsevier pp.171-182.
Kohonen, T.
(1998). Self-organization of very large document collection: State of the Art.
In: Niklasson, L., Boden, M. and Ziemke, T., editors. Proceedings of ICANN98, 8th International Conference on
Artificial Neural Networks, vol. 1, Springer, London. pp. 65-74.
Kopcsa, A. and Schiebel, E. (1998). Science and technology Mapping: A New Iteratio Model for Representing Multidimensional Relationships. Journal of the American Society of Information Science, 49(1), 7-17.
Lin, X. (1995). Searching and Browsing on Map Displays. Proceedings of ASIS 95, Chicago, 13-18.
Lin, X. (1997). Map Display for Information Retrieval. Journal of the American Society of Information Science 48(1), 40-54.
Macias-Chapula, C.A., Sotolongo-Aguilar, G.R., Madge, B. and Solorio-Lagunas, J. (1999). Subject content analysis of AIDS literature as produced in or about Latin America and the Caribbean. Scientometrics 46(3), 563-574
McLain, J. P. (1990). Bibliometrics Toolbox.. Journal of the American Society for Information Science 41(1), 70-71.
Orwing, R., Chen, H. and Nunamaker, J. (1997). A Graphical, Self-Organizing Approach to classifying electronic meeting output. Journal of the American Society of Information Science 48(2), 157-170.
Polanco, X., Francois, C. and Keim J. P. (1998). Artificial neural network technology for the classification and cartography of scientific and technical information. Scientometrics 41(1-2), 69-82.
Portal, S. G. and Thompson, A. C.
(1994). CUIB-METRIC: an integral system for metric analysis of bibliographic
information. Investigacion Bibliotecológica, 8 (16), 27-31.
Porter, A. L. and
Detampel, M. J. (1995). Technology
Opportunities Analysis. Technological
Forecasting and Social Change 49, 239-255.
Ravichandra Rao, I.K. (1996). Methodological and conceptual questions of bibliometric standards. Scientometrics, 35(2), 265-270.
Rostaing, H., Dou, H., Hassanaly, P. and Paoli, C. (1996). Dataview: bibliometric software for analysis of downloaded data. Available from: http://crrm.univ-mrs.fr
Sanz-Casado, E., García-Zorita, C., García-Romero, A., and Modrego-Rico, A. (1999). Research by spanish economists. Characteristics in terms of the scope of publications. Proceedings of the 7th International Conference on Scientometrics and Informetrics, University of Colima, Colima, Mexico, July 5-9, pp. 593-595.
Sanz-Casado, E., Suárez-Balseiro, C.A., and García-Zorita, C. (1998). Estudio de la producción científica española en biomedicina durante el período 1991-1996. Actas de las Jornadas de Documentación en Ciencias de la Salud, Zaragoza, marzo 1998. (Copies available from the authors).
Small, H. (1998). A general framework for creating large-scale maps of science in two or three dimensions: the SCIVIZ system. Scientometrics 41(1-2), 125-133.
Sotolongo-Aguilar, G. (1999). Library and Information Science Research Methods in Latin America and the Caribbean (1966-1998). Report 23, Scientific University Council (SUC), University of Havana, Cuba. (Available from the authors).
Swanson, D. R. and Smalheiser, N. R. (1997). An interactive system for finding complementary literatures: a stimulus to scientific discovery. Artificial Intelligence 91, 183-203. Available from: http://kiwi.uchicago.edu/webwork/AIabtext.html
Van Raan, A.F.I. (1996). Scientometrics: state-of-the-art. Scientometrics 38(1), 205-218.
White, H. D. and McCain, K. W. (1998). Visualizing a Discipline: An Author Co-Citation Analysis of Information Science. Journal of the American Society of Information Science 49(4), 327-355.
This document may be circulated freely
with the following statement included in its entirety:
Copyright 2000
This article was originally published in
LIBRES: Library and Information Science
Electronic Journal (ISSN 1058-6768) September 30, 2000
Volume 10 Issue 2.
For any commercial use, or publication
(including electronic journals), you must obtain
the permission of the authors.
Gilberto R, Sotolongo-Aguilar
The Finlay Institute; POBox 16017, Cod. 11600 La Habana, CUBA. E-mail: finlayci@infomed.sld.cu
Carlos A. Suárez-Balseiro
Faculty of Communication, University of Havana Calle G, No.506, Vedado, La
Habana 10600, La Habana, CUBA. E-mail: csbgv@bib.uc3m.es
Maria V. Guzmán-Sánchez
The Finlay Institute; POBox 16017, Cod. 11600 La Habana, CUBA. E-mail: finlayci@infomed.sld.cu
To subscribe to LIBRES send
e-mail message to
listproc@info.curtin.edu.au
with the text:
subscribe libres [your first name] [your last name]
________________________________________
Return to Libres
10n2 Contents
Return to Libres Home Page