LIBRES: Library and Information Science Research
Electronic Journal ISSN 1058-6768
1999 Volume 9 Issue 2; September 30.
Bi-annual LIBRE9N2
Further investigations into the first-citation process:
the case of population genetics
----------------------------------------------------------
Bry Mohan Gupta
National Institute of Science,
Technology and Development Studies
Dr. K.S. Krishnan Marg, New Delhi
110012, India
E-mail: bmg@csnistad.ren.nic.in
and
Ronald Rousseau
KHBO, Zeedijk 101, 8400 Oostende, Belgium, and
UIA, IBW, Universiteitsplein 1, 2610 Wilrijk, Belgium
E-mail: ronald.rousseau@kh.khbo.be
Abstract
In this article the first-citation
process is investigated. Former studies led to two double exponential models
for this process. The first model resulted in a concave function, the other one
in a function with an inflection point (an S-shaped function). Real data using
a year as time unit could best be described by the first model, data using two
weeks as a unit could best be described by the second one. In this note we show
that for a group of nine related data sets in the field of population genetics,
using one year as a unit, the first observation is confirmed: the concave model
can adequately describe such data.
Introduction
Science is cumulative in nature:
each new research article is built on the foundation of previous articles
(and/or books). An author acknowledges this by referring to these articles and
books in a reference list. The study of this 'scholarly bricklaying', as Price
(1963) calls it, is known as citation analysis. Citation analysis studies
different aspects of the 'Citation Culture' (Wouters, 1999): motivations for
citing, the citation network as a mathematical graph, statistical aspects of
citations and references, mappings of the citation network, etc… For reviews on
citation analysis and a theory of citation we refer the reader to (Egghe and
Rousseau, 1990; Liu, 1993; Leydesdorff, 1998; Wouters, 1999).
In previous studies (Rousseau
1993,1994) we investigated the first-citation process. Under the term
'first-citation process' we mean the abstract process that shifts a published
article from the 'uncited' to the 'cited' group. As described in (Rousseau,
1994), the publication of an article (or group) of articles can be considered
as the introduction of a stimulus in an abstract 'information space' (perhaps
Popper's World III). Then citations, as symbols for 'use' can be interpreted as
responses to this stimulus. In particular, the first citation is the first sign
of response. It is a token that the article is not left unnoticed. One can also
say that articles that have been cited (at least once) have past an initial
filter. Perhaps this filter separates the totally unused (unnoticed?) articles
from the other ones, having presumably more (scientific) potential.
A statistical study of the
cumulative first-citation distribution of a group of articles led to two double
exponential models: one resulting in a concave function, the other one
resulting in a function with an inflection point (an S-shaped function). Real
data using a year as time unit could best be described by the first model, data
using two weeks as a unit could best be described by the second one. These
observations, though, were only based on two data sets. In this note we will
show that for a group of nine related data sets, using one year as a unit, the
first observation is confirmed. The first model can adequately describe such
data. This model implies that the rate of conversion from the set of articles
that have been cited to those that have not, is a decreasing function of time.
The first-citation process as
described here has not received much attention in the scientific literature.
Yet, Moed and Van Raan (1986) and Schubert and Glänzel (1986) did consider the
time between publication and first citation as a journal indicator of
immediacy. Moreover, Glänzel (1992) found that the mean of the first response
determined to a large extent the complete citation distribution. In his study
Glänzel used stopping times (a special kind of random variables (Egghe, 1984)),
which lead to a considerably more sophisticated approach than the simple
statistical procedure used here and in our earlier study (Rousseau, 1994).
Data
Source
articles were taken from the "Bibliography of Theoretical Population
Genetics" (Felsenstein, 1981.) This bibliography was selected as the
source of our investigation because it comprehensively covers the publications
in the field of theoretical population genetics from 1870 to 1980. However, the
only source for collecting citation data is ISI's Science Citation Index, which
is only available from 1955 (leaving the retrospective SCI covering 1945-1954
aside.) As a result the period of study is restricted to 1955-1980. Moreover,
as citation data were collected manually only a selected set of data was
studied. Concretely: we only investigated the articles (from the bibliography)
published in 1955, 1958, 1961, …1979, with a three-year interval. The resulting
nine related databases suffice largely for the purpose of this study. We refer
the reader to e.g. (Gupta, 1997; Gupta et al., 1998; Kretschmer & Gupta,
1998), where this bibliography has been studied from other points of view.
Complete citation data on which our investigation is based are presented in the
appendix.
Preliminary remarks on the percentage of uncited articles
Before
explaining the model we would like to point out another aspect of the data. A
certain percentage of articles will always remain uncited. Yet, it seems that
for earlier articles a smaller percentage remains uncited. This is clearly
shown in Table 1. In the years 1955,1958 and 1961 15 to 23% of the articles
remains uncited over a period of approximately 18 years, while for later years
this percentage is considerably higher. We are unable to suggest an explanation
for this. Note also that the term 'uncited' really means 'uncited by journals
covered by the ISI database'.
Table 1
Percentages of uncited articles (each considered over a period of approximately
18 years)
|
year |
number of articles |
number of cited articles |
number of uncited articles |
percentage of uncited articles |
|
1955 |
75 |
64 |
11 |
14.7 |
|
1958 |
77 |
64 |
13 |
16.9 |
|
1961 |
122 |
94 |
28 |
23.0 |
|
1964 |
167 |
115 |
52 |
31.1 |
|
1967 |
301 |
202 |
99 |
32.9 |
|
1970 |
324 |
203 |
121 |
37.3 |
|
1973 |
418 |
282 |
136 |
32.5 |
|
1976 |
465 |
307 |
158 |
34.0 |
|
1979 |
483 |
338 |
145 |
30.0 |
The model (Rousseau, 1994)
Consider a fixed group of N articles.
Let C(t) be the cumulative number of articles cited at least once (in journals
covered by ISI) over a period of length t years. We assume that the change in
C(t) is proportional to the number of uncited articles, with a time-dependent proportionality factor q(t) = A e-at,
a ³ 0, A > 0.
This factor can be interpreted as a conversion factor. This conversion factor
is assumed to be exponentially decreasing. It describes the rate at which
articles shift from the uncited group to the cited one. Putting R(t) = C(t)/N
leads to the following differential equation:
![]()
The solution of this differential equation is the function:
![]()
where k = 1 – R(0), and b = e –A/a. For the proof we refer to
(Rousseau, 1993,1994). Note further that
![]()
This
means that in this model not all articles need ever be cited, which is a
realistic assumption. Indeed, the model predicts that 100 kb % of all published
articles will remain uncited. In (Rousseau, 1993,1994) we have shown that
citations to Russian language library science periodicals, as published by
Motylev (1981), fitted this equation quite well.
The conversion factor
Before
we turn to the results of the fitting exercise we would like to have another
look at the data to see if they indeed suggest an exponentially decreasing
conversion factor from the group of cited articles to the group of uncited
ones. Table 2 gives the cumulative percentages of cited articles in the first
five years after publication. It is
clear that this percentage increases more and more slowly. After 5 years more
than 80% of all citations have occurred. Because of this characteristic of the
data we were able to fit the double exponential model.
Table 2.
Cumulative percentages of cited articles (CPCA) in the first five years after
publication
|
CPCA in |
1955 |
1958 |
1961 |
1964 |
1967 |
1970 |
1973 |
1976 |
1979 |
|
first year |
16.0 |
9.1 |
6.6 |
3.0 |
12.0 |
5.6 |
9.1 |
13.1 |
6.0 |
|
first 2 years |
38.7 |
28.6 |
32.8 |
24.0 |
33.6 |
22.5 |
26.3 |
35.9 |
45.8 |
|
first 3 years |
54.7 |
41.6 |
47.5 |
40.1 |
44.9 |
35.5 |
42.8 |
49.2 |
56.9 |
|
first 4 years |
60.0 |
50.6 |
58.2 |
50.3 |
50.5 |
41.4 |
48.8 |
55.1 |
60.9 |
|
first 5 years |
65.3 |
59.7 |
61.5 |
55.1 |
53.8 |
45.1 |
53.8 |
60.0 |
64.0 |
Results
In order
to fit our double exponential model we have to find values for the parameters
k, b and a. Moreover A = -a ln(b). Table 3 presents the results of a non-linear
least squares fit based on Marquardt's algorithm (Marquardt, 1963). Fig. 1
illustrates the case of the 1973 data.
Table 3.
Parameter values of best fitting curves
|
data set |
k |
b |
a |
A |
R² |
1 – kb |
|
1955 |
0.828 |
0.200 |
0.200 |
0.32 |
0.992 |
0.83 |
|
1958 |
0.917 |
0.147 |
0.141 |
0.27 |
0.998 |
0.87 |
|
1961 |
0.930 |
0.241 |
0.253 |
0.36 |
0.998 |
0.78 |
|
1964 |
0.981 |
0.321 |
0.290 |
0.33 |
0.998 |
0.69 |
|
1967 |
0.872 |
0.389 |
0.310 |
0.29 |
0.997 |
0.66 |
|
1970 |
0.930 |
0.401 |
0.216 |
0.20 |
0.991 |
0.63 |
|
1973 |
0.913 |
0.352 |
0.265 |
0.28 |
0.997 |
0.68 |
|
1976 |
0.869 |
0.393 |
0.408 |
0.38 |
0.999 |
0.66 |
|
1979 |
0.934 |
0.332 |
0.600 |
0.66 |
0.994 |
0.69 |
Judging by the high R²-values we may
assume that equation (2) yields an adequate representation of the
first-citation process. This at least if data are collected on a yearly
basis. This assumption is confirmed by
a graphical analysis of the best fitting curves to the data (cf. Fig.1).
These results predict that from 1964
on, about 30% of all articles presented in Felsenstein's bibliography will
never be cited in journals covered by ISI. Before that time this percentage is
lower (between 10 and 20%). This is in accordance with the data (as described
in a previous section).
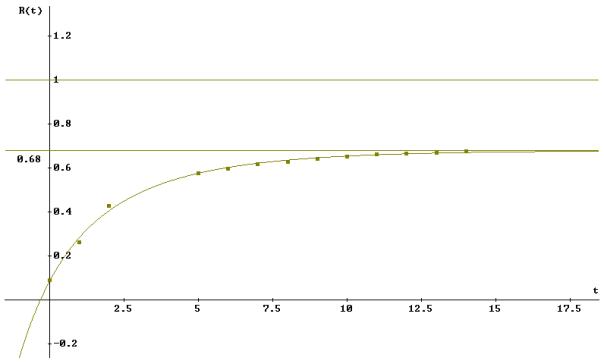
Fig.1 Best fitting curve and asymptote indicating limiting value (0.68)
for 1973 first-citation data
Conclusions and suggestions for further research
We have
shown that, for data in the field of population genetics, the first double
exponential model as studied in (Rousseau 1993,1994) adequately describes
first-citation data, collected on a yearly basis.
Most
articles, except some publications in e-journals, suffer from a publication
delay between the acceptance (after peer review) of the manuscript and its
actual publication. This, clearly, has an influence on the time between
publication and first citation (it is the publication delay of the citing
article that is important here). Hence, it would be interesting to study this
influence, e.g. by comparing first-citations for articles in e-journals and for
other articles. Note that the mechanism that is at work here (considered from a
model-theoretic point of view) is the convolution of two distributions. This
mechanism has been explained in (Rousseau, 1998) and studied in a citation
context in (Egghe and Rousseau, 2000).
Acknowledgement
The
authors thank an anonymous referee for a number of pertinent observations
leading to a more readable article.
References
Egghe, L. (1984). Stopping time techniques for analysts and probabilists. Cambridge
(UK): Cambridge University Press.
Egghe,L. and Rousseau, R. (1990). Introduction to Informetrics. Quantitative
methods in library, documentation and information science. Amsterdam:
Elsevier.
Egghe,L. and Rousseau,R. (2000). The influence
of publication delays on the observed ageing distribution of scientific
literature. Journal of the American
Society of Information Science (to appear).
Felsenstein, J. (1981). Bibliography of Theoretical Population Genetics. Stroudsburg (PA):
Dowden, Hutchinson & Ross.
Glänzel, W. (1992). On some stopping
times of citation processes. From theory to indicators. Information Processing & Management, 28, 53-60.
Gupta, B.M. (1997). Analysis of
distribution of the age of citations in theoretical population genetics. Scientometrics, 40(1), 139-162.
Gupta, B.M., Kumar, S. &
Rousseau, R. (1998). Applicability of selected probability distributions to the
number of authors per article in theoretical population genetics. Scientometrics, 42(3), 325-334.
Kretschmer, H. and Gupta, B.M.
(1998). Collaboration patterns in theoretical population genetics. Scientometrics, 43(3), 455-462.
Leydesdorff, L. (1998) Theories of
citation? Scientometrics, 43, 5-25.
Liu, M. (1993). The complexities of
citation practice: a review of citation studies. Journal of Documentation, 49, 370-408.
Marquardt, D.W. (1963). An algorithm
for least squares estimation of nonlinear parameters. Journal of the Society of Industrial and Applied Mathematics, 2,
431-441.
Moed, H. and Van Raan, A. (1986).
Cross-field impact and impact delay of physics departments. Czechoslovak Journal of Physics B, 36,
97-400.
Motylev, V.M. (1981). Study into the
stochastic process of change in the literature citation pattern and possible
approaches to literature obsolescence estimation. International Forum on Information and Documentation, 6, 3-12.
Price, D. J. de Solla (1963). Little Science, Big Science. New York:
Columbia University Press.
Rousseau, R. (1993). Double
exponential models for first-citation processes. Report University of Antwerp
(UIA). { copies available from the author }
Rousseau, R. (1994). Double
exponential models for first-citation processes. Scientometrics, 30(1), 213-227.
Rousseau, R. (1998). Convolutions
and their applications in information science. The Canadian Journal of Information and Library Science/Revue
canadienne des sciences de l'information et de bibliothéconomie, 23(3),
29-47.
Schubert, A. and Glänzel,
W. (1986). Mean response time – a new indicator of journal citation speed with
application to physics journals. Czechoslovak
Journal of Physics B, 36, 121-125.
Wouters, P. (1999). The Citation Culture. Ph. D. Thesis.
Universiteit van Amsterdam.
Appendix
Each table
presents, for a different publication year, the total number of source
journals, and, for all years, starting with the publication year, the number of
articles that have been cited for the first time during that year. The
difference between the number of source articles and the cumulative number of
articles that are cited at least once, is the number of uncited articles, as
presented in Table 1.
Table 4 1955: 75 source articles
|
year |
number of
articles cited for the first time |
year |
number of
articles cited for the first time |
|
1955 |
12 |
1964 |
2 |
|
1956 |
17 |
1965 |
1 |
|
1957 |
12 |
1966 |
0 |
|
1958 |
4 |
1967 |
1 |
|
1959 |
4 |
1968 |
1 |
|
1960 |
2 |
1969 |
1 |
|
1961 |
4 |
1970 |
1 |
|
1962 |
1 |
1971 |
1 |
|
1963 |
0 |
|
|
Table 5 1958: 77 source articles
|
year |
number of
articles cited for the first time |
year |
number of
articles cited for the first time |
|
1958 |
7 |
1967 |
1 |
|
1959 |
15 |
1968 |
0 |
|
1960 |
10 |
1969 |
1 |
|
1961 |
7 |
1970 |
1 |
|
1962 |
7 |
1971 |
1 |
|
1963 |
5 |
1972 |
0 |
|
1964 |
3 |
1973 |
0 |
|
1965 |
3 |
1974 |
1 |
|
1966 |
2 |
|
|
Table 6 1961: 122 source articles
|
year |
number of
articles cited for the first time |
year |
number of
articles cited for the first time |
|
1961 |
8 |
1968 |
1 |
|
1962 |
32 |
1969 |
3 |
|
1963 |
18 |
1970 |
2 |
|
1964 |
13 |
1971 |
2 |
|
1965 |
4 |
1972 |
1 |
|
1966 |
5 |
1973 |
0 |
|
1967 |
4 |
1974 |
1 |
Table 7 1964: 167 source
articles
|
year |
number of
articles cited for the first time |
year |
number of
articles cited for the first time |
|
1964 |
5 |
1973 |
1 |
|
1965 |
35 |
1974 |
1 |
|
1966 |
27 |
1975 |
1 |
|
1967 |
17 |
1976 |
0 |
|
1968 |
8 |
1977 |
0 |
|
1969 |
7 |
1978 |
0 |
|
1970 |
6 |
1979 |
1 |
|
1971 |
2 |
1980 |
1 |
|
1972 |
2 |
1981 |
1 |
Table 8 1967: 301 source articles
|
year |
number of
articles cited for the first time |
year |
number of
articles cited for the first time |
|
1967 |
36 |
1976 |
2 |
|
1968 |
65 |
1977 |
2 |
|
1969 |
34 |
1978 |
2 |
|
1970 |
17 |
1979 |
1 |
|
1971 |
10 |
1980 |
2 |
|
1972 |
12 |
1981 |
1 |
|
1973 |
10 |
1982 |
1 |
|
1974 |
3 |
1983 |
1 |
|
1975 |
2 |
1984 |
1 |
Table 9 1970: 324 source
articles
|
year |
number of
articles cited for the first time |
year |
number of articles
cited for the first time |
|
1970 |
18 |
1978 |
4 |
|
1971 |
55 |
1979 |
6 |
|
1972 |
42 |
1980 |
6 |
|
1973 |
19 |
1981 |
5 |
|
1974 |
12 |
1982 |
5 |
|
1975 |
12 |
1983 |
4 |
|
1976 |
8 |
1984 |
3 |
|
1977 |
4 |
|
|
Table 10 1973: 418 source articles
|
year |
number of
articles cited for the first time |
year |
number of
articles cited for the first time |
|
1973 |
38 |
1981 |
4 |
|
1974 |
72 |
1982 |
6 |
|
1975 |
69 |
1983 |
4 |
|
1976 |
25 |
1984 |
5 |
|
1977 |
21 |
1985 |
1 |
|
1978 |
16 |
1986 |
2 |
|
1979 |
8 |
1987 |
2 |
|
1980 |
9 |
|
|
Table 11 1976: 465 source articles
|
year |
number of
articles cited for the first time |
year |
number of
articles cited for the first time |
|
1976 |
61 |
1983 |
5 |
|
1977 |
106 |
1984 |
4 |
|
1978 |
62 |
1985 |
3 |
|
1979 |
27 |
1986 |
3 |
|
1980 |
23 |
1987 |
2 |
|
1981 |
4 |
1988 |
1 |
|
1982 |
6 |
|
|
Table 12 1979: 483 source
articles
|
year |
number of
articles cited for the first time |
year |
number of articles
cited for the first time |
|
1979 |
29 |
1986 |
4 |
|
1980 |
192 |
1987 |
6 |
|
1981 |
54 |
1988 |
1 |
|
1982 |
19 |
1989 |
1 |
|
1983 |
15 |
1990 |
2 |
|
1984 |
7 |
1991 |
1 |
|
1985 |
6 |
1992 |
1 |
This document may be circulated freely
with the following statement included in its entirety:
Copyright 1999.
This article was originally published in
_LIBRES: Library and Information Science
Electronic Journal_ (ISSN 1058-6768) September 30, 1999
Volume 9 Issue 2.
For any commercial use, or publication
(including electronic journals), you must obtain
the permission of the authors.
Bry Mohan Gupta
National Institute of Science, Technology and
Development Studies
Dr. K.S. Krishnan Marg, New Delhi 110012, India
E-mail:
bmg@csnistad.ren.nic.in
and
Ronald Rousseau
KHBO, Zeedijk 101, 8400 Oostende, Belgium, and
UIA,
IBW, Universiteitsplein 1, 2610 Wilrijk, Belgium
E-mail: ronald.rousseau@kh.khbo.be
To subscribe to LIBRES send e-mail message to
listproc@info.curtin.edu.au
with the text:
subscribe libres [your first name] [your last name]
________________________________________
Return to Libre9n2 Contents
Return to Libres Home Page