| Home | Contents |
4. Current Research
Current research has not to date focused on the role of the school in general on outcomes of environmental education. Virtually all research is confined to investigating effects of instruction during class time.
| Home | Contents |
4.1. Outcomes in environmental education research
Environmental education in the classroom appears to be a well established content area in formal school education (Leal Filho, 1996). In numerous countries as in Germany efforts can be traced as far back as the late 60’s and early 70’s. Most research, however, has been conducted only in the last few years and literature on this is abundant. Yet, research on the outcomes of environmental education is scarce. Leeming et al. (1993) included 34 studies published between 1974 and 1991 in their review of outcomes in environmental education. During the seven years since this publication very few studies can be added to this list (see Leeming, 1997).
Langeheine and Lehmann (1986) found evidence to support that number of years in attendance at school has a positive correlation with environmental knowledge; student participation - especially in the area of waste management at school has a positive effect on environmental activity in general; general environmental activity is supported when teachers of it are ecologically oriented and/or environmental themes are addressed at school (Lehmann, 1993); and multiple environmental projects support symbolic behavior patterns in students, who are then more likely to inform themselves and others on ecological issues.
Ramsey et al. (1981) investigated participation in a environmental project at school and its effects on environmental behavior for 30 students and an additional control group. A positive relationship between participation in the environmental project and environmental behavior is reported.
Sia et al. (1985) investigated eight independent variables for their predictive ability in regards to environmental behavior. The most stable predictors were the acknowledgment of environmental issue, recognition of own abilities to act, attitude towards technology and knowledge on strategies for environmental behaviors. These authors see the role of the school in assisting young people in developing skill competence - especially the recognition of ones own competence, acquiring knowledge of behavior strategies and in acknowledging environmental issues.
Hines et al. (1986/87) performed a meta-analysis for more than 120 research reports on environmental awareness and behavior and identified several predictors variables for environmental behavior. These include: verbal commitment to act; internal locus of control; attitude; recognition of ones own responsibility and environmental knowledge (moderate correlation between independent variables and the dependent variable environmental behavior: r=.30 for knowledge and r=.49 for verbal commitment). Leeming et al. (1993) reported similar observations.
Hines et al. (1986/87) developed a model to explain responsible environmental behavior based on these observations. The model combines personality characteristics (attitude, locus of control or internal recognition of responsibility) with cognitive elements (behavioral skills and knowledge on behavioral strategies or ecological issues). These factors contribute, as also postulated by Fishbein and Ajzen (1975), to the generation of a behavioral intention. The intention can be reinforced, for example, by the availability of behavioral opportunities, or restrained by expected and real social sanctions or economic restrictions. Situational factors which are restraining are able to undermine otherwise positively reinforced attributes (attitudes, knowledge). On the other hand, some behaviors are the result of situational factors alone (when the other remaining conditions are not satisfied).
A relevant area contributing to an ecological school culture could well lie in the cognitive domain, namely that of knowledge of behavioral skills and knowledge on behavioral strategies or environmental issues in situ.
In two investigations (Ramsey, 1989 & 1993) with a pre- /posttest design for experimental and control groups, instruction was found to influence the dependent variables identified by Hines et al. ([1986/87). The instruction method chosen was "issue investigation and action training".
Elgar et al. (1992) observe that research on effects pertains at this point in time to particular models and projects which cannot adequately represent the entire public education institution. They add that the models and projects clearly have sound aims, but that far from clear remains what the resulting outcomes of environmental education are. Furthermore, school effects are, at this time, inextricable from effects due to informal and formal environmental education of the public at large and, therefore, remain not quantifiable.
In support Hausbeck et al. (1992) found that only 12% of students in their survey obtain their information on environmental problems and issues through the school. (We, too, must not be discouraged by minimal effects of the school on students.)
Ostman and Parker (1987) found only weak evidence for the hypothesis that environmental education contributes to environmentally responsible behavior. Overall, the outcome research is not too encouraging.
| Home | Contents |
4.2. Environmentally action - What prompts it?
A further theoretical view interprets environmental problems as a threat to well being. Perception or acknowledgment of threat serves as the catalyst for a motivation to act. This concept originates in the field of health psychology and is found wide spread, i.e., in the Protection Motivation Theory from Rogers (1983). The term "threat perception" here, however, encompasses more than the personal sphere and includes other individuals, living things and entities of the physical environment.
Baldassare and Katz (1992) report that perceived threat can produce or reinforce environmental behavior. Threat perception is influenced by personality and political attitudes. Baldassare and Katz tested their model on a sample of the general population in the greater Los Angeles area. In this study it appears that the threat perceived due to environmental problems was a better indicator for environmental behavior than were demographic variables or variables on political views. This research does not seem to have been followed further.
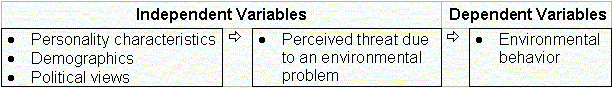
Figure 4-1: Independent and dependent variables of the Baldassare and Katz study
Threat perception is a central factor in the integrated model for environmental action motivation by Rost, Lehmann and Martens (1995). Their model "integrates" theories from Heckhausen (1985), Gollwitzer (1993), Krampen (1987), Rogers (1983) and Schwarzer (1992). Rost et al. view the genesis of an action more differentiated than, for example, Baldassare and Katz. They subdivide environmental action in three phases: motivation, action choice and volition (see the next section).
| Home | Contents |
4.2.1. The integrated model for environmental action motivation
Ideally, according to Rost (1996), motivation lies at the beginning of the genesis of an action. Motivation is also the result of an attempt to reduce environmental threat. However, the acknowledgment alone of an environmental threat is not sufficient to result in the motivation to act. Other cognitions are necessary for the motivation building phase as well as that there are other processes besides motivation building involved in the genesis of action.
Figure 4-2: Three phases of environmental action according to the integrated action model from ROST et al. (1995)
Figure 4-2 depicts - very generally - the genesis of environmental action according to the integrated model from Rost et al. and its three phases. Each phase, in turn, represents a succession of events.
The motivation phase describes that part of the process related to the formation of a motive for action to reduce an environmental threat. Recognition of environmental threat has already been mentioned as a necessary component. Yet in this model it has been broken down further into perceived vulnerability and perceived severity. Perceived vulnerability is the subjective judgment of the likelihood that the environmental threat will indeed result in deleterious effects. Perceived severity conceptualizes the idea of the seriousness of the source of the environmental threat.
|
Source of threat: |
Environmental threat/ effect: |
|
waste dump sites |
water pollution |
|
waste incineration |
air pollution |
|
fossil fuel power plants |
air pollution |
|
automotive transportation |
air pollution |
|
nuclear power plants |
radioactivity |
|
and so on... |
In addition to recognizing environmental threat other factors are important, such as:
The coping style (Krohne, 1991) refers to strategies related to processing information, dealing with distraction, future planning and self-deception. The nature of these strategies characterizes vigilant or cognitive avoiding "coping styles". A vigilant coping style characterizes someone who accepts rather than ignores information on threatening situations, confronts obstacles, plans to take measures in similar situations and tries to understand his or her own role in the scheme of things. The cognitive avoiding strategy, on the other hand, characteristically suppresses these qualities and does not promote further motivation building.
Another important determinant, yet secondary to threat perception and coping style, is, namely, that of the attribution of responsibility, and in particular responsibility for the solution of the problem. Someone who has not accepted the (partial) responsibility for the solution to a problem cannot be expected to act. These persons alternatively feel that others, for example, politicians or industry ought to be required or are better able to take action rather than themselves.
Once a motivation is formed, it is then possible according to this model to make several choices concerning the type and viability of the activity. Logically, this must occur prior to following through with one’s intention. The principle cognitions associated with the action choice phase are:
The most important cognitions during this phase are the short-term and long-term outcome expectations associated with an action. Secondly, it is very important how one feels about his or her own capabilities in carrying the action out. Only when these three cognitions are positive can an intention can be formed.
This phase begins with the anticipation that one or more alternative actions will have a positive outcome. This is still not sufficient to produce an intention. There may be several "solution" alternatives and for each a different expectation regarding how effective the solution will be on the long-term. This long-term (subjective) evaluation of the solution choice is referred to as instrumentality. It is then likely that an intention is strongly associated with high instrumentality for at least one solution alternative in reducing the environmental threat. Once a solution is found then the question can be posed whether or not the individual is suited to carry the action out.

Figure 4-3: Constructs of the Motivation and Action Choice Phases
The final stage of this integrated model is the volition phase, where intention becomes deed. Intentions for one action may compete with those of another. Between intention and deed lie intervening variables to establish when, how and where the intention is to be fulfilled. In addition, situative barriers and resources contribute cues to action. Interpretations of a situation are subjective. Cues seen as barriers, for example, as "costs" (time, money, exertion) can inhibit an intention, where as another perspective may deem the situation as conducive.
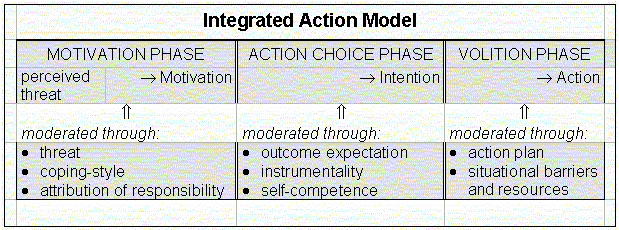
Figure 4-4: Integrated Model for Environmental Action Motivation according to Rost Martens and Lehmann (1995)
On the basis of this integrated model on environmental action motivation another model to explain and test for outcomes of environmental education at school was devised. The following two sections describe the model for environmental education outcomes at school and the survey design used to test this model.
| Home | Contents |
4.2.2. Environmental motivation and a model for environmental education at school
The integrated model (Rost, 1995) and questions related to the role of school instruction formed the impetus of the empirical study on the outcomes of environmental education at school. A new model was developed which focuses in particular on the first two phases of the integrated environmental action model from Rost et al. in a educational context. It was assumed that instruction has limited impact on the volition phase and, therefore, has been excluded from the model on environmental education outcomes (Rode, 2000). Instruction was not the only measure of environmental education at school. Other factors related to an overall school environmental context or profile, such as ecological features and measures or activity opportunities in environmental conservation outside of class, were included.
The major goal of the survey was to identify those conditions and elements of environmental educational at school which explain motivation and intention patterns identified in students. The objectives were to:
It is postulated that environmental education in practice can only be "good" if the conditions are right. If conditions are not optimal then it is likely that environmental education is something done when it is convenient to do so. If environmental education is seen, rather, as an imperative it is more likely that conditions will be met in support of it and in support of motivation and intention building in youth. This study attempted to identify conducive and less conducive contextual conditions of schools in the sense of an "ecological profile" through variety and type of environmental opportunities for students or through ecological features and environmental modifications at the school.
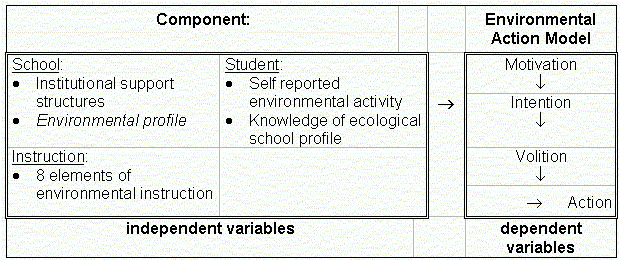
Figure 4-5: Concept and components of the empirical study on outcomes of environmental education at school (Rode, 2000)
The resulting model (Figure 4-5) encompasses the following four components:
| Home | Contents |
4.3. The parent study and survey design
Despite lacking encouragement from research, implementation of environmental education at school and environmental education initiatives have been on the rise (see Eulefeld, 1993). Students and the school administration as well as teachers have taken part in getting environmental education into the schools. Various undertakings have been chosen to promote either "environmental knowledge", "environmental consciousness", "environmental skills" and so on. In the attempt to get an initial impression on the role of schools in educating students for a healthy environment, a nation-wide survey was launched in Germany.
The survey was conducted in 54 German public schools in two "new" and five "old" federal states in 1996. Equal numbers of schools represented each of the four public school forms (Gymnasium, Gesamtschule, Realschule and Hauptschule) typically found in Germany. One-quarter of the schools were chosen specifically for their reputation in environmental education.
Data was collected on the theoretically derived variables in the form of three standardized questionnaires. Questionnaires were specifically developed for the school administration, for teachers and for students. 2365 9th graders (aged 14 to 16) and 467 of their teachers participated in the survey. All 9th grade teachers - not only those teaching in the biological sciences - were encouraged to participate.
The schools were asked to provide information on their environmental profile. Data was collected on the presence of 26 ecological features and environmental measures at the school as well as activity opportunities for the 9th graders in each of these areas. Items were chosen according to the following two criteria:
This catalog was collated from the many German publications on recommendations and suggestions for environmental measures and activities at school.
The items tend to fall into one of three categories: on site nature conservation (i.e., habitat restoration); classic environmental conservation (i.e., resource management, waste recycling); and technical environmental conservation (i.e., saving energy)
Students were asked to give information on their motivation and intentions for environmental action; self reported environmental activity both at and away from school; perception or knowledge accuracy of 26 ecological features and environmental measures at their school.
The operationalization of the variables on environmental motivation and intention followed three criteria:
The items were designed to test all the variables on motivation and intention building on four previously determined environmental threats (radioactivity, water pollution, air pollution and endangered species) and related specific environmental actions.
The various operationalizations were done in such a way that items for the variables of the action choice phase represented viable solutions for those environmental threats presented for items of the motivation phase.
The first two criteria for the construction of the items necessitate the systematic combination approach of the third criterion. This has the advantage of making it possible to analyze the data for (environmental) area specific effects.
The questionnaire for teachers contained items on environmental instructional practices, conditions at the school and among faculty members and on their environmental views. The items will not be elaborated on here as this presentation focuses on the relationship between the school environment on the whole and student environmental motivation only.
Contact was made with the schools to obtain approval for the survey. The administration received one questionnaire on the ecological profile of the school, sufficient questionnaires for all the teachers of 9th graders at the school, and enough student questionnaires for two classrooms. Official testers were organized to conduct the survey with the students. The surveying of everyone was purely voluntary. Filling out any of the questionnaires was not to exceed 45 minutes. Only those schools who completed all three survey components have been included in data analysis.
The following section summarizes the statistical methods and results leading to the design of the follow-up study on ecological school culture and its effect on students.
| Home | Contents |
4.4. Statistical measures
The intent of this research, as in the follow-up study, is to identify groups of students, not individuals, which have benefited from the efforts made at their school. Although the integrated model for environmental action does describe that persons are motivated for environmental action only once they have fulfilled several specific conditions, it does not depict a linear function between the variables of the model and a measure of environmental motivation.
For example, a perceived severe threat can influence someone’s motivation only when a vigilant or at least the absence of a cognitive avoiding coping style is given. A well defined motive can evolve into an intention only when an action solution is found with a positive promise of long term effects and it is an action that the individual feels competent in following through with.
The model is intended to aid environmental education in the school setting and is therefore most useful for educators if with it variable constellations and their prevalence among student groups can be identified and usefully interpreted and generalized. So, in addition to descriptive statistics another method of analysis has to be employed which makes it possible to identify different subpopulations of students based on student motivation profiles or responses to multiple variables.
| Home | Contents |
4.4.1. Latent Class Analysis and Mixed Rasch Models
This multivariate variable complex can be represented by either mixed distribution models or latent class analysis models (Rost, 1997 & 1996). These models subdivide the heterogeneous population under investigation into homogenous subpopulations, such that each subpopulation is characterized by a particular variable profile or prevalence of the variables.
With the case of latent class analysis, the definition of homogenous is taken very strictly to mean that within a subpopulation (or latent class) all individuals have the same expectancy values for the prevalence of the analyzed variables. Different constellations of variables and their prevalence are expressed as distinct variable profiles and are identifiable as the latent classes of the investigated population.
This means of analyzing the data is useful when it is noticeable that for a substantial number of students the same link in the chain is broken. It is conceivable, for example, that in addition to a subpopulation of students with a high prevalence and positive constellation for all variables, there is a second group of students for which instrumentality is positive but their lacking self competence inhibits the intention to act on their preferred choice of solution.
The Mixed Rasch Analysis is a more general form of Latent Class Analysis. The homogeneity of the classes is applied more loosely in that within a latent class no longer are identical expectancy values for all persons required (Rost, 1990 & 1996). More important is that each class conforms to the Rasch model. Which means that persons of a class are homogenous in the sense that there exists a variable for all upon which everything else seems to depend. "Everything else" means that the prevalence for all other variables is higher or lower comparative to individuals of another latent class.
Each person receives a score indicating the likelihood that they belong to each of the latent classes. Further analysis of the data requires that each individual is assigned a categorial variable indicating which latent class they most likely belong to.
Once classes of students have been identified it is then possible to analyze the school data for explanations leading to the differences found in student groups. For example, similarities between schools may be identified that explain why significantly more of their students belong to the class having lower self competence.
| Home | Contents |
4.5. Major results on student motivation, environmental activity and knowledge
The complete data on the 9th graders, the dependent variables, from the student survey on have been described at length in the final report of the parent study on the outcomes of environmental education at school (Rode, 2000). Only a selection is included here which pertains to the following three assumptions:
| Home | Contents |
4.5.1. Student environmental motivation: four profiles
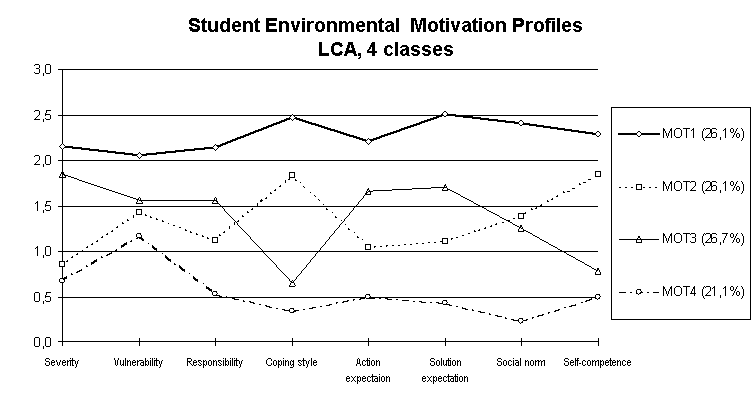
Student environmental motivation has been described by the integrated action model (Rost, 1996). Eight of these variables characterizing the motivation and action choice phases of the model have been operationalized and included in the student survey. This data set is a multivariate variable complex and has been analyzed using the Latent Class Analysis model described in previous section. Figure 4-6 shows the variable profiles of 4 latent classes (n=2365).
Figure 4-6 Four Student Environmental Action Motivation Profiles
This figure represents student assignment probabilities to a particular class and the resulting four motivation profiles. Scores are represented on the y-axis by a scale from zero to three. The eight cognitions characterizing environmental motivation we tested are represented on the x-axis.
(These eight variables are taken from the Integrated Action Model, Rost, 1995) and is described in somewhat greater detail in Section 4.2.1.)
The 2365 students in our study vary significantly in their environmental motivation profiles. 26.1% of the students score consistently "high" for all motivation variables (class 1). 21.1% tend to score "low" for these items (class 4). Students in the fourth class seem to be little motivated where their involvement in the solution or reduction of environmental problems is concerned. Two moderate groups each with approximately 26% remain.
It must be stressed that these profiles are the result of student reports on themselves and do not necessarily reflect objective measures of these variables. Nevertheless, in further reference to the motivation classes the following abbreviations will be used:
| Class 1: | "MOT1" | high scores for all eight motivation variables ‘sensitive optimists’ |
| Class 2: | "MOT2" | moderate motivation with moderately high self competence ‘go with the flowers´ |
| Class 3: | "MOT3" | moderate motivation scores with moderately low self competence ‘self-doubters’ |
| Class 4: | "MOT4" | low scores for all eight motivation variables ‘skeptics’ |
Furthermore, students of all four types are in attendance at all 54 schools. The percentages, however, of 9th graders belonging to each of the four profiles at any individual school may vary greatly - from 6 - 46%.
In summary, the most important result from this data is that students in general can be characterized by one of four motivation profiles.
| Home | Contents |
4.5.2. Student environmental activity
Information in the form of self reports was collected from students on two types of performed environmental activity: a) activities performed at school within the 1995/96 school year and b) activities away from school within the past year
It is proposed that all students do not perform the identical environmental activities. Furthermore, it is postulated that environmental activity preferences among students will be influenced ultimately by their motivation. Here, though, environmental activities at school (and elsewhere) are not interpreted as the result of environmental education, but rather, as active educational opportunities and, therefore, as an independent variable. It is expected, therefore, that:
Question 11 asks students to report which commonly found environmental activities they participated in during the last school year. The eight activities provided include:
Students marked whether they performed these activities continuously, regularly, once in a while or not at all. This data was suitable for latent class analysis.
Figure 4-7 shows the four latent classes identified for student environmental activity at school. Student response "not at all" received a score of zero; "once in while" got a one, and so on. These scores are represented by the scale on the y-axis.

Figure 4-7: Profiles of student environmental activity at school
All in all, student activity at school in general is not spectacular. One-fifth of all students did not respond to this question. On average, students are active in 1.1 activities at school; whereby about 20% of all students reported that they rarely participated, if at all, in any of these activities for that school year. The cumulative average for all students at each school varies within a range of 0.3 to 2.2 activities.
Latent class analysis on these eight items revealed four groups of students. These results are depicted in Figure 4-7.
Although we intended to measure student responses to activity opportunities at school, no distinction was made between mandatory and voluntary participation. It was observed at some schools that participation in, for example, clean up activities on the school grounds is a mandatory activity and not an "opportunity" as originally intended. It is expected, therefore, that student responses will be consistently higher for items students are required to perform and that higher scores for clean-up and sorting waste activities reflect this rather than student preferences.
It is not easy to explain the participation of class three. It doesn’t make much sense to perform some of these activities "once in a while". Students, perhaps, have tried to give a socially desirable response to our survey instead of their actual participation.
These four classes will be referred to from now on as:
Class 1: "SKL-ACTIV" high participation for at least several of the eight environmental activity items
Class 2: "SKL-LBE" "a little bit of everything"
Class 3: "SKL-CLEAN" moderate participation in waste related activities
Class 4: "SKL-LO" low scores for all eight environmental activities
B. on environmental activities away from school:
Question 13 asked students to report on environmental activities elsewhere. Students were given a list 19 activities and were asked to mark whether or not they:
This sort of data is suitable for latent class analysis, however, the interpretation is next to impossible due to the number of variables (in this case equal to the number of items, or 19). So, categories of activities were built and, consequently, the number of variables were drastically reduced to a more manageable number for the sake of a meaningful interpretation. Each of the new variables has then multiple indicators.
First, according to the original design these activities were grouped into one of the three categories most commonly associated with environmental activities:
However, the results did not lead to a meaningful interpretation of student environmental activity away from school. So, it was decided to try the following alternative categories:
|
|||
| pa= paper recycling | pc= reusable containers | ||
| pb= minimal packaging | pd= use of ink bottles | ||
|
|||
| oa= avoiding car use | oc= environmental group | ||
| ob= on resource use | od= on family energy use | ||
|
|||
| ia=on contents/ ingredients | ic= on new technologies | ||
| ib=on environment | in general | ||
|
|||
| na= planting trees | nd= plant hedges | ||
| nb= contructing frog fencing | ne= habitat care | ||
| nc= collect litter | nf= construct bird houses and the like | ||
Using these alternative categories four new variables on categories of environmental activity were constructed (Figure 4-8).
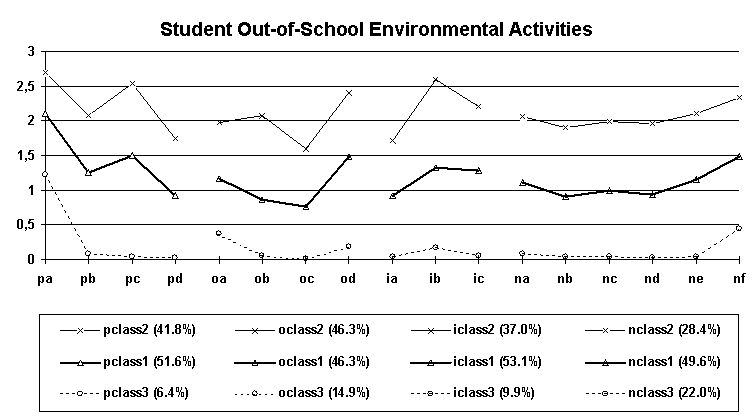
Figure 4-8: Scales for four categories of student environmental activities elsewhere
The scale on the y-axis represents student response scores. An LCA reveals three classes which differ only in degree. This is a very strong indication that at this level of analysis ("items") differences among students are of a quantitative nature only.
To check whether or not this result is quantitative, for example, whether the kids most active in all four areas are the same kids, the data can be evaluated once more but now at an aggregated level ("variables"). If these variable measure only quantitative differences in students, then the results of the second LCA should produce groups of students which behave similarly but with different "intensity" very much like the three groups already depicted above. (Imagine a continuous line connecting all classes of the same level.) This must not be the case. If the results are able to detect qualitative differences among students, i.e., whether there exist certain preferences for activity areas, then different activity patterns should emerge. Particularly interesting patterns are indicated when the activity preferences or "lines" cross. Figure 4-9 shows the results of the second LCA for the degree of student preference (high, moderate and low) for activities of each activity category.
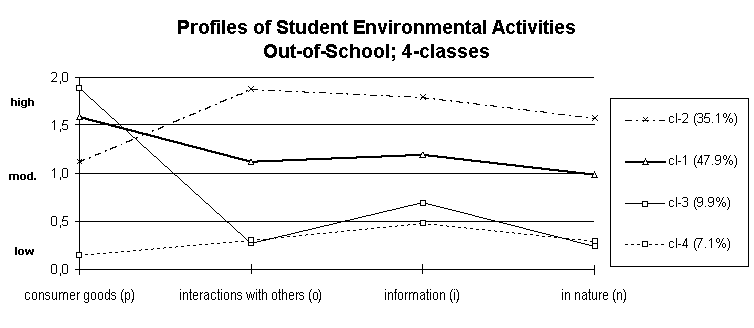
Figure 4-9: Four profiles of student environmental activity elsewhere
This figure, for the most part, suggests quantitative differences among students. This is indicated by the lines running more or less parallel to each other. However, the contrast between student preferences for activities in the "consumer goods" area and their preferences for the other three activity areas reveals qualitative differences among students, too.
Latent class analysis indicates four prominent student profiles for environmental activity away from school:
These four classes for activity outside of school will be referred to as:
Class 1: "ELSE-AVE" moderate participation, preference for consumer goods activities
Class 2: "ELSE-ACTIV" above average participation, consumer goods activities show dramatic decline in participation
Class 3: "ELSE-CONSUM" highest participation in consumer goods activities, otherwise low participation
Class 4: "ELSE-LO" low scores for all four activity areas
In summary, the data on student environmental activity does suggest that students do tend to have distinct activity patterns for both in-school environmental activities and activities performed elsewhere.
| Home | Contents |
4.5.3. Student conservation knowledge
Information was collected from students on their knowledge of conservation (ecological features and environmental modifications) at their school.
It is proposed that students vary regarding how much and what they see of conservation going on at their school. Furthermore, it is postulated that conservation knowledge is a result of environmental education efforts at the school. Now, one could reasonably think that motivation plays a role here, but this study concentrates on the roles other factors play in motivation and not the other way around. So, the effect to test for is whether or not student knowledge on conservation can work motivationally for students. It is expected, therefore, that:
Students were given a list of 26 items potentially present at their school and requested to respond to this question with either "present", "present but only partially", "not present" or "I do not know".
Student reposes were compared with school administration responses for identical items (see section 4.6). Students were given a score of correct when both student and administration responses were identical. (The administration was not given the choice "I do not know". "Present but only partially" was re-coded as "present".)
It is not useful to analyze each of the 26 items individually. It is, additionally, only possible to make comparisons among schools when the data pool is the same. It was therefore necessary to find meaningful categories for the conservation data and include items shared by a majority of the schools.
Originally it was intended to use the traditional categories: water conservation, nature conservation, energy conservation, resource conservation, and transportation. But these did not prove to be useful in the interpretation of the data. The three categories that were chosen finally were:
The remainder of this section describes student conservation data for these three categories: correct scores, incorrect scores and the response "I do not know".
As it has already been mentioned, there is a difficulty when comparing student responses from different schools. Students are more likely to acknowledge what they can see than what they cannot. This difficulty for students in recognizing what they do not see leads them to respond "I do not know" more frequently for these items than for items that are present at their school. Therefore, the correct response to items that are present at the one school cannot be compared to the correct response "not present" for students at another. It was then decided to evaluate the data for four items per category. Each school in the subsequent analysis had to have all four items of the category under investigation. Although the total number of schools in the sample is 54, significantly fewer schools had all four items for a particular category.
Figure 4-10 depicts student knowledge for three conservation categories.
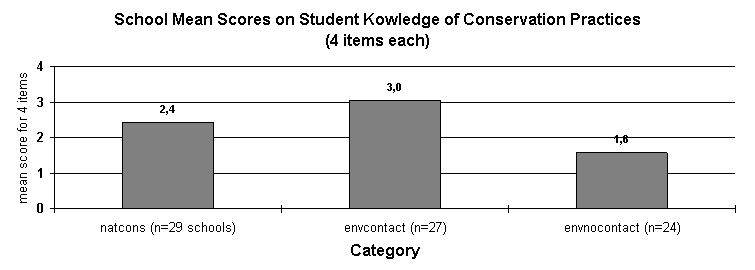
Figure 4-10: Mean student score for knowledge on school conservation
This figure shows that school conservation is most accurately known for items on environmental protection where student contact to them is likely (score is three of four items). This is followed by nature conservation items (2/4). The more or less "invisible" category of conservation without contact is seen least (1.5/4).
We then looked to see what percentage of the students did very well or very poorly for each of the three categories. Figure 4-11 shows the distribution of student scores according to how much they have acknowledged for three conservation categories.
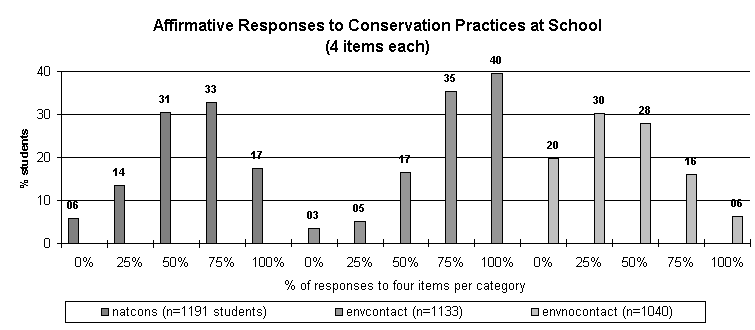
Figure 4-11: Student acknowledgment of all items for three categories
This figure suggests that conservation features and modifications are most readily seen or recognized by students if they have some sort of contact with them. Only 3% of the students failed to recognized any of the four items. Student perception continually improves with each added item. Virtually 40% of the students recognized them all. The tendency to recognize the items in this category are clearly favored.
Although the data for nature conservation shows that relatively few students have recognized none of the features or modifications at their school (about 6%), the trend for improvement is not as great as for the "conservation with contact" items and there is a significant drop in the number of students who have recognized all four items. This category does not exclude the possibility for student contact but it is less likely for some of the items that all students have had direct contact. Furthermore, this category is interesting because it is highly visible and apparently still not seen. This suggests that seeing with the eyes is not equivalent to perception of things using (in addition to sight) other senses, or in association with other contexts.
The remaining conservation category at school reserved for things that are often done (see section 4.6) but not made explicit to students (energy, water) is clearly not recognized as well by the students. 20% of the students recognized not one of four items. Another 30% recognized at most one. The number of students recognizing more than one item rapidly drops. 6% of all students noticed all four of these items.
Figure 4-12 depicts the distribution of student scores for three conservation categories according to how much they have failed to acknowledge or the degree of their uncertainty.
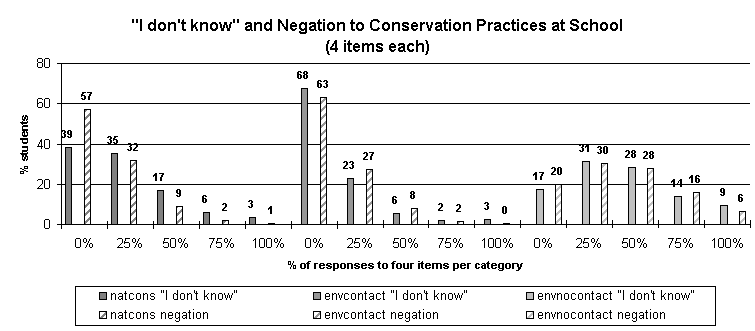
Figure 4-12: Comparison of student responses "I do not know" and negation of items for three categories
As students had the additional option of responding "I do not know" in addition to "not present" if they were not certain of an items presence, these responses need to be looked at together. What this data shows us is that students are not only more perceptive of a particular kind of item (items with which they come into contact with), they are increasingly less certain in their to items they are unfamiliar with.
With the exception for the category "1 item/ conservation without contact" students consistently respond more frequently with "I do not know" than with "not present" for items they are less familiar with. Students are most likely to respond "not present" over "I do not know" for items they expect they should in fact know.
This result is interesting in light of the fact that observations indicate that efforts are increasing dramatically at schools to address issues and activity for students in conservation in this third category. If these observations are correct, then student perceptions of conservation at their schools should be shifting in the near future.
In summary, this section has revealed three categories to describe student perception of conservation at their school suggesting that perception itself and the certainty with which students respond is influenced by the degree to which students are in contact with the conservation features or modifications in question.
The "grape vine" just doesn’t reach all ears. And although "seeing" may be "believing", touching is better.
Before going on to the next section on the school conservation facilities it may be useful to point out that in the introduction of each of the sections on student motivation, activity and knowledge, I stated expected results that have not yet been addressed. In order to answer these questions it is first necessary to obtain a general overview for each of these variables individually. Next it is important to see the general results for the school data. Following this section I will then show the more complex relationships among these variables.
| Home | Contents |
4.6. Major results on school conservation profiles
School conservation profiles comprise both features and modifications at the school and student activity opportunities. The major results concerning these aspects are discussed in the following two sections.
| Home | Contents |
4.6.1. Conservation features and modifications at school
This survey included a section for determining the "ecological profiles" of schools. This was done through information on ecological features and environmental modifications at the school.
A separate questionnaire for the school administration requested information on the presence of 26 items on ecological features and environmental modifications of the school. These 26 items were collected from contemporary literature and include things such as, natural habitats, public transportation access, waste sorting facilities, water saving fixtures. Furthermore, information was collected on "opportunities for student participation" for all 26 items and how often or regularly this occurred.
The 26 items were chosen on the basis that 1) it would be reasonable to expect its presence at a school and 2) its suitability for conservation focused activities for youth. The items included traditional nature conservation items (i.e., constructing habitats for animals), items on resource and waste management (i.e., sorting waste), transportation (i.e., adequate bike parking), energy (i.e., insulation, or turning heat down at night) and water (water flow reduction).
It is known that there are schools that make a special effort to reflect environmental values in their practices as well as school design. There are competitions and special projects, partnerships and working-groups specially devoted to themes related to school environments and environmental issues. It is therefore expected that:
Main findings were disappointing.
|
Conservation Features and Modifications |
|||||
|
"outside" |
% |
"inside" |
% |
||
|
ns4 |
Indigenous plantings |
100 |
ts4 |
Turning the heat down at night |
98 |
|
us1 |
Public transport access within 10 walking min. |
96 |
ts3 |
Toilette paper Recycling |
89 |
|
* |
Enough parking for bikes |
94 |
ts1 |
Double glazed windows |
82 |
|
* |
Benches and tables on grounds |
87 |
us4 |
Wash basins with cold water |
82 |
|
ns2 |
School boundary of wood, stone, plant |
87 |
us2 |
Sorted waste collection |
80 |
|
* |
Avoidance of pesticides |
87 |
us3 |
Drinks in reusable containers |
70 |
|
ns1 |
Natural habitat or similar |
74 |
ts2 |
Automatic closing doors or wind stop |
56 |
|
ns |
Bird houses or other support for animals |
74 |
ts |
Energy saving lighting vs normal bulbs |
54 |
|
ns3 |
Tree ring to let water seep through |
72 |
ns |
Paper birds on windows to prevent birds flying against them |
44 |
|
* |
Sheltered bike parking |
52 |
ts |
Insulation of outer walls |
39 |
|
ns |
Paths, surfaces allowing water drainage |
52 |
us |
Water flow reduction for toilets |
37 |
|
ns |
Foster care for a stream etc |
22 |
us |
One-hand tap regulation instead of two |
35 |
|
ns=nature conservation "ns1"= "1" of the 4 most common items of category "ns" us= env. protection with contact ts= env. protection without *= category assignment not possible |
us |
Water flow reduction at sinks |
20 |
||
|
ts |
Noise reduced flushing system |
17 |
|||
Figure 4-13: Conservation features and modifications at 54 German public schools
It is possible to run a latent class analysis for 26 items. It, however, was unsuccessful here in producing qualitatively different ecological profiles of schools. The two groups that did emerge are not useful in either describing differences among schools nor are they helpful in gaining an understanding about differences in student motivation. These two groups differ in quantity not in variety of conservation. Furthermore, schools reporting significantly more conservation did not differ in the composition of students attending them (with regards to activity, knowledge or motivation).
As it is literally mind boggling to interpret the data for 26 items, categories of conservation are required to reduce the data into manageable and more meaningful chunks. The categories "traditional conservation in nature", "resource management", "transportation", "energy" and "water" did not, however, prove informative in interpreting the data. All schools reported features and modifications in virtually all categories making a distinction among school "ecological profiles" impossible.
A further attempt to gain information on schools followed after sorting the 26 items into two new categories which may be more meaningful from a student’s point of view (according to accessibility or contact) rather than a teacher’s (according to themes).
In Germany there is a common distinction made between that which is done to preserve plant and wildlife and general environmental integrity and that which is done to prevent or reduce environmental hazards such as pollution. I have called items which more closely relate to the first category "nature conservation" (developing natural habitats) and the second "environmental protection". The "environmental protection" category has been broken down again into two groups which reflect an increased or decreased likelihood for student contact: environmental protection with contact (sorting waste, drinks offered in reusable containers) and characteristically more technical environmental protection for which student contact is still very low (water flow restriction measures, isolation), a cultural component.
Nature conservation at school may indeed involve student contact but it is not as explicit, at least not for the majority of the students. For example, although it is usually set up and expected that all students sort their waste, it is often the case that only a selected few students are involved with a habitat restoration project. For most students "contact" is restricted to visual perception.
In summary, the new categories to describe conservation features and modifications at schools are:
Figure 4-14 shows the distribution of the data on school conservation features and modifications according to the new conservation categories.
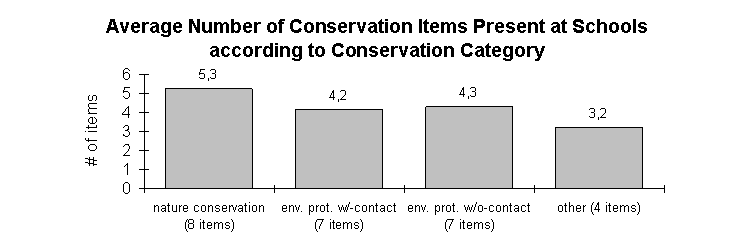
Figure 4-14: Average number of conservation items at schools for three categories
This figure indicates that there is moderate representation in all three categories. Nature conservation items are favored most, however, the real difference is minimal. The so-called more technical conservation measures are as represented as the classic environmental protection measures which is interesting when compared to the results of section 4.5.3 on student conservation knowledge. A comparison of Figure 4-13 and Figure 4-14 clearly reveals that there is a discrepancy between what is present at schools environmentally and what students are aware of.
An attempt was made to distinguish among schools qualitatively by identifying schools which score:
Latent class analysis of school data according to these three categories is not satisfactory. The results support the two class solution depicted in Figure 4-15.
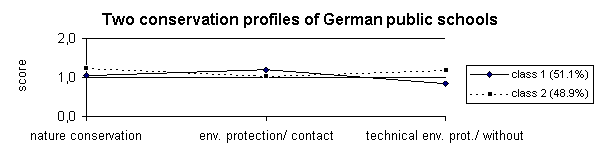
Figure 4-15: Ecological profiles of schools according to three conservation categories
This figure suggests that there are two groups of schools. At about half of the schools conservation is more prevalent in both nature conservation and technical environmental protection categories. At the remaining schools, environmental protection with student contact is more prevalent than conservation measures of the other categories. These qualitative distinctions are quite small and may be vulnerable to change for different samples of schools.
In summary, this data has suggested that it may be more meaningful to use categories that reflect student access to these conservation measures and that differences using this instrument are at best quantitative. It was not possible to make satisfactory qualitative distinctions among school ecological profiles. The consequence here is an evident need for a reevaluation and further development of the test instrument.
| Home | Contents |
4.6.2. Conservation activity "opportunities" at school
Similar to the previous section information was collected and evaluated on student activity opportunities at school. The school administrations reported student activity opportunities for each of the 26 items on school conservation measures. Schools also reported whether the activity was carried out "once", "occasionally" or "regularly".
Figure 4-16 shows responses of 54 schools on student activity opportunities offered.
|
Student Activity Opportunities in Conservation at 54 German Public Schools Mean activities in conservation per school = 4.2 |
|||||
|
"outside" (M = 3.2) |
P % |
O % |
"inside" (M = 1.0) |
P % |
O % |
|
Indigenous plantings |
100 |
46 |
Turning the heat down at night |
98 |
4 |
|
Public transportation within 10 minutes |
96 |
9 |
Noise reduced flushing system |
98 |
4 |
|
Enough parking for bikes |
94 |
9 |
Toilette paper Recycling |
89 |
4 |
|
Benches and tables on grounds |
87 |
39 |
Double glazed windows |
82 |
4 |
|
School boundary of wood, stone, plant |
87 |
28 |
Wash basins with cold water |
82 |
2 |
|
Avoidance of pesticides |
87 |
26 |
Sorted waste collection |
80 |
48 |
|
Natural habitat or similar |
74 |
63 |
Drinks in reusable containers |
70 |
19 |
|
Bird houses or other support for animals |
74 |
56 |
Automatic closing doors or wind stop |
56 |
2 |
|
Tree ring to let water seep through |
72 |
20 |
Energy saving lighting |
54 |
0 |
|
Sheltered bike parking |
52 |
2 |
Paper birds on windows |
44 |
15 |
|
Paths, surfaces allowing water drainage |
52 |
2 |
Insulation of outer walls |
39 |
2 |
|
Foster care for a stream etc |
22 |
17 |
Water flow reduction for toilets |
37 |
2 |
|
P = presence at school |
One-hand tap regulation instead of two |
35 |
2 |
||
|
O = opportunity for student activity given |
Water flow reduction at sinks |
20 |
2 |
||
Figure 4-16: Activity opportunities for students at schools in conservation
This figure shows the frequency (in percent) of conservation activity opportunities relative to the overall presence of these items in German public schools. While it is true that activity opportunities are greater for those conservation items most frequently found at school (indigenous, bird houses and natural habitat). It is not a rule. Not only are there items which are frequently present for which there is seldom an activity opportunity presented (heating, energy and water conservation), there are also instances of activity opportunities in conservation for items that are comparatively poorly represented (sorted waste collection and reusable beverage containers).
Figure 4-17 depicts the average number of conservation activity opportunities offered at the schools according to the three previously described categories.
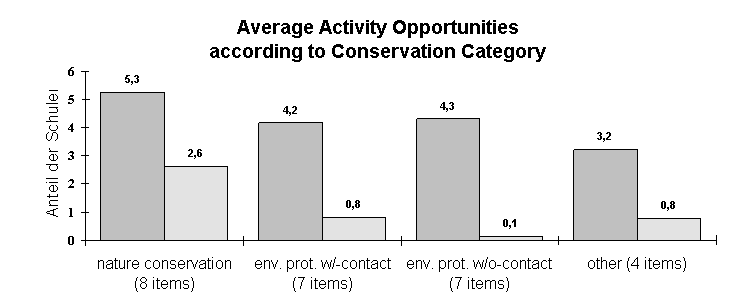
Figure 4-17: Average number of activity opportunities offered at schools in three categories
In summary, we had anticipated more variance than this survey was able to provide. Our data on students suggested that there could well be an explanation for student variances at the school level. Based on this information, however, we are not any closer to knowing more about what some schools are doing which seems to have a positive effect on students.
It must be mentioned that the results from both sections on school ecological profiles are especially disappointing in light of the fact that one-quarter of our sample was specifically chosen for their efforts in environmental education and it was not even remotely possible to identify these schools based on our data.
| Home | Contents |
4.7. Results on the relationship among student variables
Having the basic results on student motivation, activity and knowledge and the (lack of) results on school ecological profiles, it is now possible to look at further associations among these variables. In the next section we shall see what effect student reported activity at school has on motivation. And as there is little consensus on what environmental activity is, we shall compare these results with data collected on student environmental activity elsewhere. Then we shall look at potential effects of student knowledge on motivation as well as if there is an effect between student activity and student knowledge. As we have already suggested, the results on the school ecological profiles are so minimal that an effect on student motivation will hardly be measurable. Thus, we shall be spared unfruitful diligence and instead I shall suggest which improvements could be made when measuring school effects and introduce the follow-up study.
| Home | Contents |
Effects of conservation activity at school on motivation
In section 4.5.1 it was proposed that:
Results indicate that motivation can be meaningfully described by the cognitions defined by the integrated action model (Rost, 1996 and section 4.2.1) and that students can indeed be identified by one of four motivation profiles (section 4.5.1).
It remains open whether or not motivation actually underlies activity (point 3). And we shall not be able to prove here whether or not motivation underlies all or only particular forms of environmental activity.
Secondly, it was formulated that:
We have shown that we are able to identify groups of students based on their activity patterns at school.
It should be stressed again that student activity here is interpreted as an active educational opportunity (independent variable) rather than the result of environmental education at the school as commonly understood an as suggested by the point 3 mentioned at the very beginning of this section. An example of an active educational opportunity could be an activity to acquire experiences in support for or against alternative solutions to an environmental problem, or in support of self competence for particular skills useful in carrying out environmental activity.
So, in wanting to understand more about student motivation, we can look at the activity groups students belong to for each of the four motivation profiles identified. The following Figure 4-18 depicts student motivation as a function of the activity type.
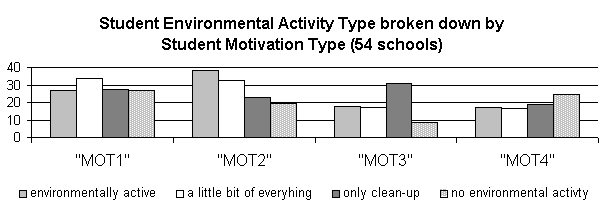
Figure 4-18: Student motivation and student activity at school
This figure suggests that student motivation can be characterized by activity preferences at school.
A one-way ANOVA indicates that only the results discriminating motivation groups "go with the flow" from "sensitive optimists" are not significant. All other differences are significant.
In summary, there is a correlation between student motivation and student educational activity opportunities in conservation that suggests that environmental motivation can be characterized by the types of school activities students perform.
For example, 74% of the students belonging to the environmentally active group tend to belong to motivation type 1 or 2. This percentage decreases to approximately 38% for students who are active only in the area of waste management. Thus, if environmental activity is a factor in motivation, it is then quite unlikely that clean-up activities will encourage highly motivated students and, therefore, we see the percentage of highly motivated students decreases for this category.
Students of higher motivation participating in predominantly clean-up activities only may very well be less at schools were participation is "mandatory" or the overall number of these students at the school may be fewer. It is not possible to answer these questions with this data.
The following figure depicts student motivation according to the conservation activity opportunities of students elsewhere.
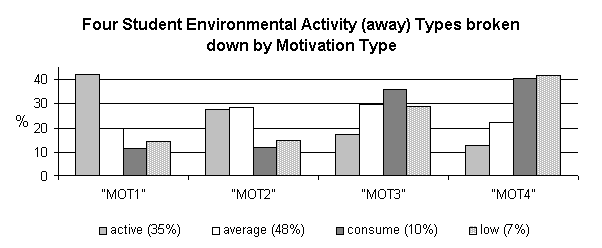
Figure 4-19: Student motivation and student activity elsewhere
This figure suggests that student motivation can be characterized by activity preferences elsewhere, also. However, the activity patterns are more dramatic.
In general, it is noticeable that not only are more kids "active" elsewhere (35%) than at school (9%), far fewer students are inactive, too (7% versus 31%).
A one-way ANOVA indicates that only the results discriminating motivation groups "self doubters" from "skeptics" are not significant. All other relationships are.
In summary, comparison of motivation groups with regard to activity preferences reveals that students do show distinct activity preferences which, in turn, may be used to characterize student groups and students of the same motivation group are not similarly influenced by activities at school and those elsewhere. This difference may in part be explained by situational factors such as the doubtful voluntary character of some school activity "opportunities".
(At this point it would be interesting to look more closely at the two sources of activity with regard to student motivation but this would distract from the present focus.)
| Home | Contents |
4.7.2. Effects of conservation knowledge on motivation,
In section 4.5.1 it was proposed that student knowledge on conservation can work motivationally for students and that conservation knowledge is a result of environmental education efforts at the school. It was therefore expected that:
The classification that was used to categorize conservation knowledge distinguishes among items that are closely related to:
Results indicate that these categories offer a meaningful interpretation of the data suggesting that student perception of conservation at their school and the certainty with which students respond is influenced by the degree to which students are in contact with the conservation features or modifications at issue (point 1 above).
It remains to be seen whether conservation knowledge affects student motivation or not. To understand more about student motivation and conservation knowledge, we shall look at how well students of each motivation group score on knowledge items. First, Figure 4-20 depicts the mean scores ("correct") of four motivation groups for each knowledge category. (Compare this figure with 4.10.)
Figure 4-20: Student motivation and knowledge scores
This figure suggests that conservation knowledge and student motivation are related.
Figure 4-21 takes a close up look at the scores on knowledge for the category "nature conservation". In this figure it is not the mean score for the entire category that is shown, rather it is the score broken down by quartiles, e.g. the first column (starting on the far left) represents the number of students who belong to the highest motivation category and scored better than 75% for the four items on "nature conservation" followed by those that scored better than 50%... and so on.
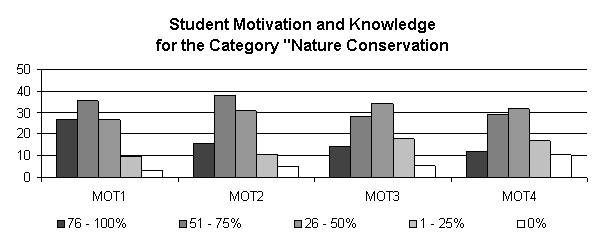
Figure 4-21: Student motivation and knowledge category "nature conservation"
This figure further supports that knowledge and motivation correspond.
The following figure compares motivation and knowledge for "environmental protection with contact" and "more technical environmental protection" categories.
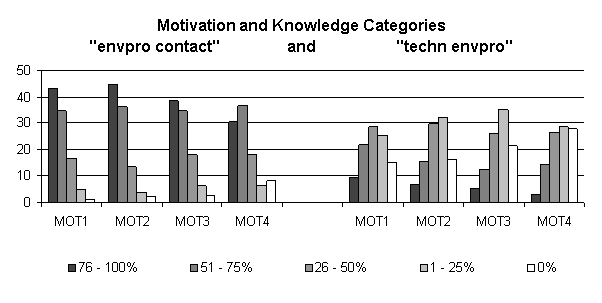
Figure 4-22: Motivation and knowledge categories "environmental protection with contact" and "more technical environmental protection"
This figure shows that the relationship between knowledge and motivation holds true for the remaining knowledge areas "environmental protection with contact" and "more technical environmental protection" with a noticeable distinction between the two. Scores are on the whole better for the category areas "environmental protection with contact". This may suggest that motivation is indeed supported by knowledge which is likely attained in conjunction with student "contact" or activity. The more contact, the more knowledge; the more knowledge, the more motivation.
Regardless of the category, students who score well on knowledge items are most likely students with high motivation. The higher the knowledge score is, higher motivation can be expected.
The third point, that schools whose students perform proportionally better on knowledge items will qualitatively differ from other schools, is handled in section 4.8.
In summary, this data supports the idea that knowledge on conservation at school may affect environmental motivation in students and suggests that there is a positive correlation between them. Students with high motivation tend to have better knowledge on their school’s nature and environmental conservation; students with low motivation have less knowledge. This trend is weakened for items on environmental conservation where student contact is likely. This suggests that the school (contact) has a moderating influence on student knowledge which is stronger than preferences attributable to student motivation. Furthermore, the better the mean knowledge score is (at a school), the greater the representation of students with higher motivation.
| Home | Contents |
4.8. Relationships between school and student variables
In section 4.6 it was explained that:
In order to calculate the effects schools have on students it is necessary to have a manageable handful of school types denoting schools of a different character. It was, however, not possible to make satisfactory qualitative distinctions among school ecological profiles.
Distinguishing among schools, for example, by the number (more/ less) and general diversity (great/ little) of their engagement in conservation at school - although possible - has not proven meaningful in interpreting differences in students.
The generalization, the more conservation at a school, the more likely opportunities will be, sounds logical and the data partially supports this. It is not, however, reliable. From the data, for example, it was not possible to support the generalization, the more conservation in the area "nature conservation" at a school the more likely activity opportunities will be offered in this area. The generalization ought to be interpreted, rather, that schools cannot possibly offer educational activity opportunities for conservation features and modifications they do not have.
At best, this data has suggested that it may be more meaningful to use categories for conservation at school that reflect student access to these features and modifications, rather than the thematic categories generally used in the instruction of conservation (energy, water, transportation...).
Not having satisfactory categories of schools it is not possible to calculate school effects on student conservation activity, knowledge or motivation.
The consequence drawn from this section is an evident need for a reevaluation and further development of the test instrument on school "ecological profiles" and is the subject of sections 4.9 and Chapter 5.
| Home | Contents |
4.9. Methodological problems
What interests me is the influence of school, the environmental culture there, on the environmental activity of young people. It is not evident to me that the school as a whole has been integrated in research on environmental education and behavior before. Deficits include:
Our own data collected from 9th graders on themselves suggest several distinctive qualities among them. Students tell us that they differ in their environmental motivation, environmental activity and on their knowledge of conservation at school. What they also tell us about themselves is that there are several recognizable patterns among these differences. Not only do we find that students tend to have one of only four environmental motivation profiles, but students of each motivation profile show similarities in environmental activity and conservation knowledge.
Furthermore, these student subpopulations are found at all schools. On the one hand, this suggests that these four motivation subpopulations are typical of students found throughout the country. Yet, it has also been observed that schools vary considerably in the composition of student subpopulations.
So, in light of the fact that each school has all four kinds of motivated students represented there - in varying amounts, it is therefore conceivable, on the other hand, that to some degree schools themselves may be influencing the variance among the students attending them.
Intuitively we know that schools differ in a variety of ways concerning environmental matters - ideologically, practically or aesthetically. One school may emphasize a particular theme such as alternative energy use and conservation. Another may place a lot of value in kids trying out ideas that they have come up with themselves. Yet another may be very consequent in having the latest in technology. And still others - albeit not shining examples - are making an effort anyway they see they can.
Is it then possible that we can find no distinctions among the outcomes of different environmental education strategies? For the sake of any and all education, I hope not!
For the survey conducted in 1996 on outcomes of environmental education at school and described here at length, there were two sources of information which were to 1) help discriminate among schools as a whole and 2) identify elements of an ecological school profile that have an influence on student motivation. The first source of information was provided from the ministries of education of the seven federal states where we were testing and intended to identify so called model schools of environmental education. These schools are not otherwise similar. One quarter of our sample were schools chosen on this basis.
The second source of information was the survey section on ecological features and environmental modifications given to the school administrations. Items on conservation as well as student activity opportunities were intended to generate a so called ecological school profile.
Both the selection from the ministries and the ecological profiles test failed to generate information useful for discriminating between schools or in explaining the variance among student motivation subpopulations. The "model" schools and schools who reported more and varied conservation at school as well as greater student activity opportunities did not differ significantly from other schools. This result is unsatisfactory. The conclusion was that our data on schools was insufficient for discriminating among the various conservation and student activity strategies at schools which make a difference for students.
These results, the successes and the failures, lead to a follow-up study on the "ecological culture" of schools and the development of the instruments to measure it.
It would not be possible to conduct a new study. Rather, an extension on our first survey was undertaken so that the previous data base could be used and expanded. Already there was good information on 1) student conservation knowledge about their schools, 2) student motivation to act environmentally and 3) self-reported environmental activity.
More and better information is needed, however, on the schools about their "ecological culture". In short, it was expected that:
No further data could be collected from the students on point 2. The follow-up study is limited to developing and testing instruments intended to identify the structural cues - be they physical, practical, organizational, or interpersonal - of the ecological culture at school which make a difference for students.
The central idea investigated here will be: a school with a pronounced ecological culture has greater student participation opportunities and its students are more knowledgeable and significantly more environmentally motivated.
| Home | Contents |