|
Search | Back Issues | Author Index | Title Index | Contents |
![]()
D-Lib Magazine
|
|
|
Cat S. McDowell |
![]()
IntroductionIn September 2005, the status of institutional repositories in the United States received its first in-depth treatment, thanks to the groundbreaking work of Clifford Lynch and Joan Lippincott. Their article, "Institutional Repository Deployment in the United States as of Early 2005" provided some of the first hard figures on the number of operational repositories at American academic institutions, as well as some of their characteristics.1 Since that time, several other reports have attempted to replicate and expand upon their work, most notably the Association of Research Libraries' SPEC Kit 292 and the MIRACLE Project's Census of Institutional Repositories in the United States.2,3 The growing body of literature in this realm underscores America's critical role in the evolution of scholarly communication worldwide and to the open access repository movement in particular. It also reveals a growing preoccupation with methods and metrics by which to evaluate the success of these repositories. Two years after Lynch and Lippincott's seminal work, it is time to once again take stock of institutional repositories in America. This article will do so by revisiting several of the areas treated in that groundbreaking work, analyzing new statistics and utilizing some new approaches. First, an expanded perspective on current IR deployment in the U.S. and its rate of growth will be presented, employing an expanded data set and a different data-gathering method. Total item counts will be examined as a method of comparing repository size, one of the most quantifiable characteristics of IRs, even if a somewhat controversial measure of success. From these item counts, recorded over precise time increments, rates of six-week and annual growth will be benchmarked. It will be argued that these longer-term growth statistics are a more effective measurement of repositories than one-time-only counts. And finally, estimates of content material types throughout the entirety of U.S. collegiate institutional repositories will be provided and then presented as an evaluative tool, although a problematic one.Methodological DifficultiesStudies of the status of institutional repositories in America, including those listed above, have heretofore been based largely, if not entirely, on survey responses. While surveys can be effective data gathering tools, they are subject to inherent potential inconsistencies. Most notably, there is no way to guarantee that those who do respond are representative of the entire community being studied, and the risk that respondents will use varying interpretations of questions and vocabulary is ever-present. Lynch and Lippincott intentionally chose not to define "institutional repository" for participants, allowing each institution to decide for itself if it had what should be considered an IR. The MIRACLE project similarly did not define IR, but asked simply "how you would characterize the status of your institutional repository (IR)?" Some might interpret this as an indication that at this stage of deployment in America, most collegiate institutions can agree on what IRs are. However, this is increasingly not the case; as the MIRACLE project later stated, "there is no consensus in what institutional repositories are for." As IRs emerge from their embryonic stage, increasingly varied contents, platforms, purposes and policies are also emerging, making a tightly prescribed definition more difficult. While there are advantages in not forcing institutions to fit into preconceived ideas of what they are, what they have, and what they do, the downside is that in a world of diverging ideas about IRs, these studies may be comparing apples to oranges. Defining "Institutional Repository"To mitigate the potential for varying definitions and interpretations to skew results, this study was completed using a one investigator/one definition method. That is, the determination of what an IR was and the application of that definition to various repositories was made only by the investigator. The criteria for determining what could be categorized as an institutional repository was made as specific and quantifiable as possible. For the purposes of the study, an institutional repository:
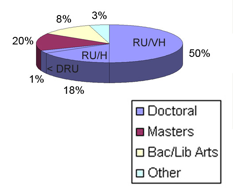
Data GatheringThe study was also designed to address a comparative lack of literature specific to American academe, where OA mandates don't yet exist and where faculty culture seems more entrenched in old publishing models than European counterparts. Therefore, while the study was restricted to American academic institutions, no specific subset such as ARL or CNI members, or doctoral-granting institutions, was targeted. It was hoped that the study results would therefore be relevant and useful to all U.S. colleges and universities, regardless of library status, student body size, or ranking. Instead of sending out surveys and trusting a sizable sampling would respond, this investigator went looking for them. This method was made possible in large part by platform user group documentation online, specifically the DSpace Instances wiki,4 BePress (formerly Proquest) Digital Commons repositories list,5 and the Registry of Open Access Repositories (ROAR).6 Beginning on November 1, 2005, each of these sites has been checked for American additions every six weeks. (This article presents data from November 1, 2005 through March 2, 2007.) In addition, twice a year all 281 doctoral-granting universities and the top 104 ranked Liberal Arts colleges – the most likely of academic institutions to have an IR – were subjected to Google search projects. Internet searches were performed on institution names linked with "institutional repository", "e-scholarship", or related vocabulary. Although there continue to be repositories that fly beneath the radar of this project and others that are excluded here but represented in other studies, this process nevertheless provides a comprehensive analysis of IR deployment in America where comparison of "apples to apples" is more assured. Selected Findings1. Extent of implementation and characteristics of implementers One initial hypothesis of this study was that although the use of vague or non-existent definitions might lead to an over count, the small sample size of the SPEC Kit and Lynch and Lippincott surveys might be under representing the number of IRs at American colleges and universities. Lynch and Lippincott accounted for approximately 41 repositories in March of 2005 (approximately 39 at doctoral-granting institutions). In November 2005, a month after the publication of their article, my study was tracking 68 academic institutions with IRs, including the two statewide consortiums in California and New York. 69% of those repositories were at doctoral-granting institutions and 48.5% were at ARL member schools. Exactly half of the schools with IRs in America at that time were classified by the Carnegie Foundation as very high research activity doctoral-granting universities (RU/VH), the highest of three categories of doctoral institutions in its classification system, which also includes high research activity (RU/H) and basic doctoral research university (DRU) (see Figure 1.1).
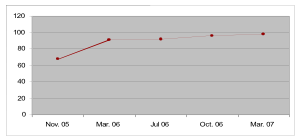
Almost a year after Lynch and Lippincott, the ARL SPEC Kit reported 37 operational IRs among its members in the U.S. and abroad, based on a January 2006 survey. At the same time, my study included 73 academic institutions with IRs, only 34 of which were ARL member schools – proof that the popularity of IRs had already spread well beyond the elite group. Interestingly, however, the SPEC Kit noted that "the growth rate appears to be leveling off at this point," while simultaneously indicating statistically that many members were still in the planning phase (p. 13). While a leveling-off did occur in the rate of new IR deployment, according to my data it came after a peak in March 2006, when the number of repositories I could account for rose to 91, primarily due to the activation of three new consortial IRs representing 15 different institutions (see Fig. 1.2).
In the intervening year, this project was not able to post a net growth of 10 in the total number of IRs in America. At least five institutions shut down sites, and while test repositories continued to crop up with some regularity, as the MIRACLE study also demonstrated, many of these test systems never seem to make it out of pilot phase. The MIRACLE study, in fact, found only 48 fully "implemented" IRs as of July 2006, but 70 universities that were "planning and pilot testing" repositories – although it is extremely unclear what the distinction between the two is (p. 1, 39). In the year since first taking stock of IRs, several other statistics concerning implementing institutions have seen significant change as well. One of the most interesting is the rise of deployment by smaller institutions. By November 2006, colleges and universities with student bodies under 15,000 accounted for more than half of IR implementers in America (see Fig 1.3). Although in popular rhetoric IR implementation was occasionally still portrayed as a trend primarily at larger schools with more faculty and graduate scholars, only 16% of schools with IRs had over 30,000 students, while 38% of implementers had student bodies under 10,000. Not surprisingly, however, over 2/3 of these smaller schools participated in consortial IRs.
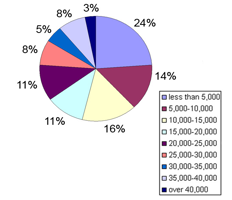
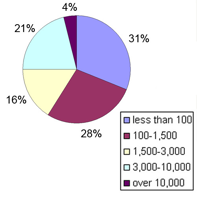
2. Size of Repositories Although the quality of deposited content is one indicator of successful recruitment, sheer quantity is also necessary for repositories to further the cause of open access. Repository quantity or size is also one of the most tangible, quantifiable mechanisms for evaluation. While Lynch and Lippincott admirably addressed the difficulties in determining a standard unit of measurement, newer studies, most notably Davis and Connolly, have effectively referenced item and record number totals in examining subsets of IRs.7,8 Item totals are particularly useful as a comparative tool in the American academy, where 94% of universities with institutional repositories that fit this study's criteria use only two platforms, DSpace and Digital Commons, ensuring a relatively standardized method of tabulation. For this project, total item counts for DSpace repositories were documented at six-week intervals, beginning November 2005. Initially, data was gathered by visiting each repository, browsing by titles, and recording the total of items that could be shown from the results page.9 Item totals for Digital Commons repositories were recorded on the same days, usually taken from the right side search box of each installation where one could "Search all [X] papers." Earlier installations and other repositories without a tabulating display were hand-counted by collection and tallied by student assistants. Although examined for institutional similarities including student body size, number of faculty, and ranking, Carnegie classification was found to be the best predictor of repository content totals. At the outset of the study, 1/3 of non-consortial repositories had fewer than 100 total items deposited. Half of these smallest repositories were at institutions classified as Baccalaureate, and in fact every one of the Baccalaureate colleges with an IR fell into this category. In addition, not a single Baccalaureate college, Masters university, or DRU had more than 500 items in its repository. As Figure 2.1 shows, the number of IRs in each item range consistently decreased as the item count range increased, and even as the ranges expanded. MIT alone saw a tally of over 10,000 items, thanks largely to massive document upload shortly before this study began. The mean item total was 2,067, but it dropped to 1,761 when the high (MIT) and low were excluded. (The SPEC Kit reported an average of 3,480 two months later) (p. 84). A year later, repositories with contents over 3,000 items saw the greatest proportional increase, with 24 institutions (or 25% of implementers) achieving content totals over 3,000 items (see Figure 2.2). However, it is not surprising that all but two of the institutions in this category are classified as high (RU/H) or very high research (RU/VH) universities by the Carnegie Foundation. Additionally, the nine largest IRs in America were all at schools ranked in the top 100 by U.S. News & World Report.10 Conversely, of the 30 institutions with IR totals under 100 items (representing 31% of implementers), 24 (or 80%) were classified as Baccalaureate, Masters, Specialty, or DRU. The average number of items per repository was 2,740.
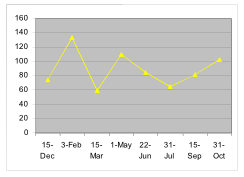
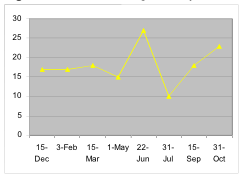
3. Rate of repository growth However, the use of static numbers such as the above is a problematic tool for gauging IR success. Although surveys continue to collect this data, the depiction of repository status they provide does not account for discrepancies in operational longevity. Comparing IRs active since 2002 with those that have been up only a few weeks is admittedly misleading and unfair to institutions still in the infancy phase of repository administration. Furthermore, it presents only a snapshot of American repositories at a singular time, not taking into account trends revealed over the course of many weeks, months, or years. Therefore, this study evaluated repositories a year after item totals were first recorded for them, in order to better understand growth patterns. Six week expectations Results indicated that the average rate of growth per IR per six weeks was generally between 10 and 20%, with an average low of 4% and a high of 44%. The biggest six-week gain recorded was 15,017%, while the proportion of IRs recording sub-1% growth each 6-week period held relatively stable at around 20% (that is, 1 in 5 repositories). When calculated by item numbers, the average growth per six weeks ranged between 59 and 134 items per IR, with the yearlong average being 89 items per 6 weeks (see Fig. 3.1). However, the median growth by item, which is significantly lower, may present a more accurate indication of expected growth. As Figure 3.2 demonstrates, the median growth per repository ranged between 10 and 27 items each six-week period, with a yearlong average of 18 items per repository per six weeks.
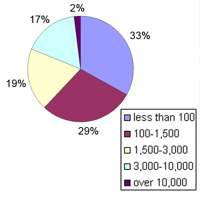
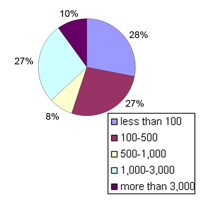
Annual gainSixty percent of the 50 repositories for which item count data was available every six weeks for a year recorded less than 100% growth – that is, they never doubled. The median growth was 52% annually. However, these percentage statistics are fairly problematic as a comparative tool, in that repositories that started very small sometimes recorded huge growth percentages even if they only added a comparatively small number of items, while IRs that started large sometimes posted misleadingly small growth percentages. Therefore, growth in absolute numbers is probably a more effective measure of IR success, and certainly a more normalized instrument. The mean growth for U.S. repositories over a twelve-month period, generally from November 2005 to November 2006, was an increase of 1,100 items. The median annual increase was 366 items, or one new submission a day. Figure 3.3 illustrates growth by item ranges, where IRs that increased by less than 100 items made up the largest proportion of American academic IRs (28%). Once again it was Carnegie classification that institutions in these item ranges have most in common, with 11 out of 15 schools that grew by fewest number of items classified as Baccalaureate, Masters, DRU, or Special. Lower ranked graduate degree-granting programs also faired poorly, with 72% of US News Tier 3 and Tier 4 schools that deployed IRs accumulating less than 500 items in a year in them. Conversely, 13 out of 15 schools that saw the greatest annual item total increase were classified as RU/VH.
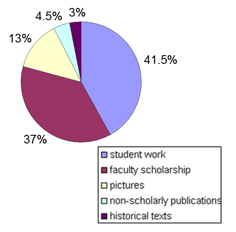
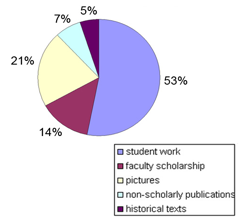
4. Proportion of types of materials in repositories Lynch and Lippincott first documented the trend in diversified contents of U.S. institutional repositories, noting perhaps with a hint of surprise that they "go far beyond e-prints," despite the previously noted assumption that pre- and post-prints would comprise a significant, if far from singular, portion of deposits. The SPEC Kit similarly posed the "contents question" to survey respondents, but also only gathered data on formats collected, not the proportion of formats currently deposited. While case studies on American institutional repository contents (and the difficulty of collecting faculty pre- and post-prints in particular) abound,11 few comprehensive, quantitative analyses have been undertaken. The difficulties in performing such a study mirror those already mentioned, not the least of which is variant definitions of format types. The MIRACLE study was one of the first to tackle the problem of quantifying IR types, but it did so by separating implementers into two very subjectively defined groups, and then presented results only in terms of averages. MethodsDespite the inherent difficulties in performing such an analysis, twice during the past 18 months the investigator and a team of student assistants have attempted to categorize the contents of all the institutional repositories being tracked at that particular time. The formats were based largely on those used by Lynch and Lippincott and the SPEC Kit, but some related groups were combined to ease the process. Contents were classified primarily based on community self-identification; that is, an assumption was made that all items in the "Engineering Working Papers" community were in fact working papers. Occasionally, contents were tallied at the item level, based on item title, if community or sub-community identifications were not transparent. IR contents were classified into the following types: ETDs; e-prints (pre- or post- print articles); working papers and technical reports; conference proceedings and presentations; e-journals and e-books; learning objects; multimedia files (digital audio/video); datasets; pictures (images); digitized archival documents and university records (historical texts and primary sources); non-scholarly institutional publications; undergraduate student work; graduate student work (non-ETD); and course content (syllabi, assignments, lectures). Neither the count nor the categorization is a perfect science, but this data from the last content categorization in November 2006 is nevertheless the first estimate of the entirety of IR contents in America yet offered. Composite resultsAs shown in Fig. 4.1, student work accounts for the largest percentage of items in IRs. Approximately 41.5% of all items in American academic IRs were student-produced, including over 93,000 ETDs. Another 11,000 items, or 4.5% of repository contents, were other student-created works, primarily senior honors theses. The prevalence of ETDs will come as no surprise to readers of any of the afore mentioned studies, which have also documented the phenomenon. At many institutions ETDs are simply the lowest hanging fruit, and new submission batches can generally be counted on each semester. About 37% of items in IRs are faculty scholarly output – generally, although not universally, the primary works IRs were designed to collect. However, the percentage of peer-reviewed works – pre- and post-prints, e-journal articles, and e-books – is considerably smaller, around 13%. At the time of the initial analysis, two schools alone, MIT and the California Institute of Technology, contained almost half of all refereed works in U.S. IRs. The remaining 23% of faculty works in IRs are gray literature, items that have not been subjected to peer review but are scholarly in nature. Working papers and technical reports make up the highest percentage of gray literature, and again, two schools, Michigan and Georgia Tech, at one time represented 85% of these. The remaining 1% comes from other non-published and non-peer reviewed materials related to faculty scholarship, including conference presentations, learning objects, podcasts and other multimedia, and datasets. IRs in the U.S. contained over 33,000 digital pictures in the fall of 2006, representing approximately 13% of all items in repositories. A little over 1/3 of those pictures are archival in nature, scanned historic images from Special Collections and/or Archives departments. A slightly smaller percentage are digitized slides meant primarily for use in a specific course, and the remaining portion are primarily scholarly in nature. This latter group is comprised of images that serve as sources for or supplements to faculty research, including several large collections that are botanical in nature or pertain to archaeological dig sites. Non-scholarly publications make up the next largest portion of IR content, representing an estimated 4.5% of all items in IRs. For the purposes of this study, this category included both institutional promotional materials such as newsletters, brochures, and guides, and primarily record-keeping works such as agendas, meeting minutes, accreditation documentation, and annual reports. A remaining 3% of items in IRs fell into the category of historic textual documents – things that were distinguished from "pictures" in their textual nature, even if captured in tiff or jpeg format. However, most of these were digitized from print sources and saved in PDF form. These, too, were usually created by archival departments, and tended to include items like commencement speeches, old course catalogs, and newspaper clippings. Conditional ResultsIt should come as no surprise to those following IR deployment that some of the earliest and most vocal American IR implementers are frequently the statistical outliers and curve-breakers in metrics studies. In particular, at the time of this categorical content analysis, five universities stood out from the rest in terms both of item totals and content types. The repositories at MIT, Ohio State, Michigan, Cal Tech, and Georgia Tech comprised five of the top six largest IRs in American academe; at one time, MIT alone accounted for over 17% of all items in IRs nationwide. When the top five were combined, they accounted for a disproportionate amount of the scholarly works contained in IRs nationwide. Figure 4.2 shows the estimated total IR composition by format if data from these five universities is excluded. Without them, the total number of student work rises to 53% and images increase sharply from 13% to 21%, while faculty output drops to about 14%, with only 7% of contents nationwide being refereed – about the same proportion as the non-scholarly publications such as newsletters and annual reports.
Conclusions1. Quantity measuresOne implication inherent in all the studies cited here is that the number of U.S. college and university implementers represents one criterion by which the overall success of IRs in that community can be gauged, or at least a method by which the evolution of the movement can be tracked. However, this is dependent on data that represents the entirety of American academic institutions and that uses similar understandings of "IR." Earlier surveys, while useful, generally under-counted the number of U.S. IR deployers and may have inadvertently led to misrepresentations and criticisms of American efforts. Conversely, the MIRACLE Project findings may be slightly over-representing the number of IRs in America due to their inclusion of a large number of vaguely defined "planning and pilot-test" repositories. Other measures of quantity, including repository size and growth, are also consistently called upon as evaluative frameworks for IR success locally and globally. This assessment of repository size, as measured by total item count, confirms other studies, both anecdotal and data-driven, that content recruitment continues to be difficult at U.S. academic institutions. Many publicize and register their repositories, but have difficulty gathering even a 100-item starter collection; Baccalaureate colleges by and large have fallen into this category. The correlation between institutional Carnegie classification and the size of the IR they operate is undeniable, with all but the RU/VH institutions fairing comparatively poorly in repository size evaluations. This trend holds true in annual item growth rates as well, where the majority of IRs saw less than a 500 item net increase; the minority that did were at research-intensive schools. At a median growth rate of 1 item a day, IRs in America will likely not achieve the critical mass to significantly impact open access or change modes of scholarly communication for some time to come. 2. Quality measureDespite expanding definitions of what IRs are and what they do, institutional repositories have yet to shake the association that brought them to the forefront of librarians' attentions in the first place: a hope that with the rise of IRs (and subsequent expansion of open access to scholarship) would come some relief to the "crisis in scholarly communication." Arguably most IR projects in America are undertaken in the hopes that a significant portion of scholarly output will eventually find their way to the repository, even if they are not self-submitted – and even as the scope of target content is witnessing a trend toward expansion in this country. The plethora of articles devoted to the difficulties of collecting faculty scholarship in American IRs, and especially the lack of self-archiving, reveals that librarians and other open access proponents in America still associate IRs with this type of content, and thus deem it the highest quality content type. However, as evidenced by other studies and verified again by this one, faculty output is not finding its way into institutional repositories in the U.S. in large numbers, except at some of the largest, most research-intensive universities. The prevalence of peer-reviewed work – estimated here at only 13% nationwide – and the well-documented difficulty of recruiting works of any type is not currently facilitating significant inroads in the open access movement. It is doubtful that IRs will prove to alleviate the crisis in scholarly communication, at least the way we initially expected, any time soon. However, the success of some of the earliest and highest-classified U.S. institutions in implementing IRs, as gauged by the criteria in this study, should provide hope to later entrants into the community and should continue to influence the way we evaluate the potential of these repositories in the U.S. AcknowledgementThe author is grateful for the support of Tim Bucknall and the help of student assistants, including Kerry Bannen and Rebecca Boger. References1. Lynch, C.A., and J.K. Lippincott. 2005. Institutional Repository Deployment in the United States as of Early 2005. D-Lib Magazine 11 no. 9 (September) <doi:10.1045/september2005-lynch>. 2. University of Houston Libraries, Institutional Repository Task Force. 2006. SPEC Kit 292: Institutional Repositories. Washington, DC: Association of Research Libraries. <http://www.arl.org/bm~doc/spec292web.pdf>. 3. Karen Markey et al. 2007. Census of Institutional Repositories in the United States: MIRACLE Project Research Findings. Washington: Council on Library and Information Resources. <http://www.clir.org/pubs/reports/pub140/pub140.pdf>. 4. DSpace Instances wiki. 2007. <http://wiki.dspace.org/index.php//DspaceInstances>. 5. Proquest Digital Commons. 2007. Repositories List Website. <http://www.bepress.com/ir/customers.html >. 6. University of Southampton. 2007. Registry of Open Access Repositories (ROAR) Website. <http://roar.eprints.org/>. 7. Davis, P.M., and M. J. L. Connolly. 2007. Institutional Repositories: Evaluating Reasons for Non-use of Cornell University's Installation of DSpace. D-Lib Magazine 13 no. 3-4 (March/April) <doi:10.1045/march2007-davis>. 8. For an earlier example, see Ware, M. 2004. Institutional Repositories and Scholarly Publishing. Learned Publishing 17 no. 2 (April) : 115-124. 9. The author is grateful to Matthew Connolly of Cornell University Library, who later created for me a tool that automates this process. 10. America's Best Colleges 2007. 2006. Washington, D.C.: U.S. News & World Report <http://www.usnews.com/sections/rankings>. 11. For example, see Foster, N.F., and S. Gibbons. 2005. Understanding Faculty to Improve Content Recruitment for Institutional Repositories. D-Lib Magazine 11 no. 1 (January) <doi:10.1045/january2005-foster>; and Morgan, E. L. and Team IDR. 2006. Institutional Digital Repository Phase I Final Report. Notre Dame, IN: University Libraries of Notre Dame. <http://www.library.nd.edu/idr/documents/idr-final-report.pdf>. Copyright © 2007 Cat S. McDowell |
|||||||
| |
|||||||
|
Top | Contents | |||||||
| | |||||||
|
D-Lib Magazine Access Terms and Conditions doi:10.1045/september2007-mcdowell
|