CHAPTER IX
Division Wrap-Up
In January of 1969 the 9th Division experienced an impressive surge in most areas of performance which lasted six months, after which time the Division began to redeploy. It is difficult to pin down the exact reasons for this surge. However, some of the factors involved are set forth below.
In the late fall of 1968, our various management improvements began to bear fruit and the Division began to firm up across the board. The most important of these was that all of our rifle companies were up to strength and we had more rifle companies operating in the field on a daily basis. Our battalions for the first time were organized on the normal square table of organization and equipment. In January we finally received three assault helicopter companies and two air cavalry troops on what was in effect an attachment basis (permanent or semi-permanent assignment and control) . For the first time we had the total assets to go into high gear.
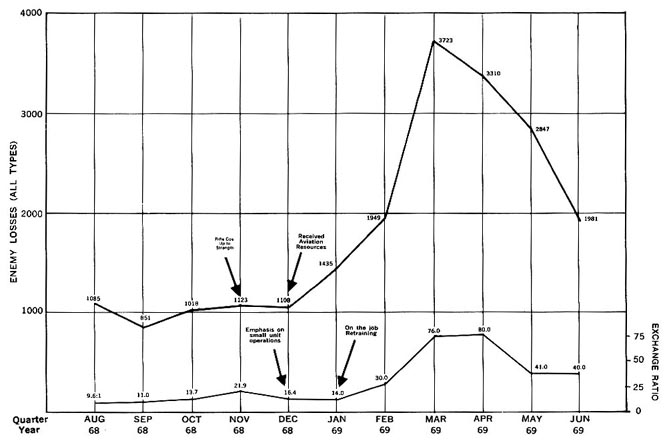
We had experienced considerable success in breaking down to company level operations in areas where the enemy had been badly cut up. As can be seen in Chart 24 our overall eliminations began to drift up while our friendly losses went down, thus improving our exchange ratio. As a result we decided to stress small unit operations particularly at night. The results were encouraging but not all good. We had several small tactical defeats which under investigation showed that our night ambushes and daylight patrols in some cases were pretty sloppy.
We therefore tried to quick-fix this by very simple, repetitive on-the-job training in night ambushes, daylight patrolling, combat shooting, and booby traps. After about a month this program took effect and the results were dramatic. Starting in late January 1969 everything began to click, and the enemy losses and the exchange ratios skyrocketed and friendly losses went down. For a period of five months the monthly gross enemy losses were from 200 percent to 300 percent over the average of the previous period, and the exchange ratios were from 150 percent to 500 percent over the previous average. In other words, enemy losses were appreciably greater while friendly losses were reduced. (See Table 20.)
[184]
CHART 24-ACTIVITY LEVELS-9TH DIVISION, AUGUST 1968-JUNE 1969
[185]
One must give the enemy some credit for this upsurge. They had planned an offensive in the winter of 1969 and it ran head on into our peaking of effort. Most probably the enemy started his offensive in late December or early January as our exchange ratio dropped slightly (18.8 to 15.6) , although enemy losses went up 30 percent (1,108 to 1,435) . It is also apparent that their losses from October 1968 through January 1969 crippled them badly which helped the effectiveness of friendly operations to surge and remain high until July 1969.
One can theorize that this peaking of results was due to a relative collapse of the enemy structure, a raising of the friendly skill level, an effective integration of our effort, a constant review and quick fixing of our operations, and possibly the achievement of tactical and technical surprise from which the enemy could not recover.
If one looks at each of the areas of major activity, the improvement rate was fairly constant but definitely weighted towards night operations. The increase in Viet Cong eliminated during night operations between January 1969 and March 1969 was 300 to 400 percent as compared to an increase of 100 percent during daytime operations. (See Table 21.)
The skill factor is more difficult to isolate. A sampling indicated that the infantry exchange ratio went up to about 40 to 1. However, air cavalry and sniper exchange ratios were extremely high and night infantry exchange ratios were around 100 to 1. We were unable to isolate any other sub-exchange ratios. However, it was obvious that the cumulative effect of improved friendly skill (and probably degraded enemy skill) was very large.
Although certain technical areas (for example air cavalry and snipers) did very well, it was our judgment that the basic infantry effort was central-the others revolved around it.
One might also theorize that the peaking of efficiency was due to the combined efforts of a group of first-class brigade and battalion commanders, plus the tremendous morale surge of the infantry when they realized that they were cutting the enemy to ribbons (coupled with the consequential loss of morale on the enemy side).
The most graphic example of the peaking effect was in our 2d Brigade. It had traditionally been used to clean out difficult enemy base areas with riverine operations and, as a result, had a rather heavy deliberate style (much like a Marine amphibious assault). However, by much hard work, it was able to shift over to the more open small unit style. It was put into Kien Hoa Province-a real Viet Cong bastion, taken off its boats, and buckled down to work.
[186]
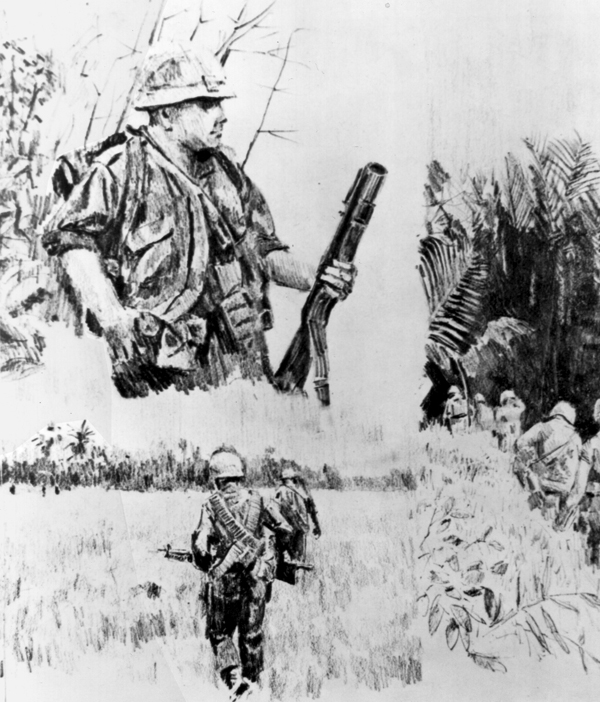
PATROL
Fortunately, the enemy was numerous and overconfident and really did not realize what was happening until it was too late.
TABLE 28-2D BRIGADE STATISTICS
| TIME PERIOD | VC KIA | PW | HC | VCI | TOTAL VC LOSSES | U.S. KIA | U.S. WIA |
|---|---|---|---|---|---|---|---|
| Apr-Jun 68 | 417 | 40 | 2 | - | 459 | 96 | 649 |
| Dec | 391 | 38 | 13 | - | 442 | 18 | 136 |
| Jan 69 | 469 | 35 | 7 | 5 | 516 | 25 | 158 |
| Feb | 704 | 38 | 18 | 6 | 766 | 27 | 191 |
| Mar | 1,185 | 39 | 34 | 5 | 1,263 | 8 | 195 |
| Apr | 1,254 | 52 | 20 | 0 | 1,326 | 11 | 195 |
| May | 984 | 36 | 12 | 4 | 1,036 | 21 | 201 |
[187]
The figures tell the story. (See Table 28.) In the last half of 1968, under Colonel George E. Bland, the Brigade began to tighten up; in Jan. and Feb. 1969 it hit its stride; and in the months of March, April and May under Colonel Rodman C. Rainville, the Brigade reached a plateau of skill and effectiveness which was really amazing. In these three months, the brigade averaged over 1000 enemy per month eliminated. Its exchange ratios were astronomical, peaking at 158 to 1, an elimination ratio which is possibly amongst the highest achieved in Vietnam. (By contrast, its elimination ratio in a somewhat comparable period in 1968 was 4.3 to 1.) This remarkable record was achieved in continuous heavy fighting as shown by the friendly wounded rate, which was around 200 per month. Turning from the figures to more general results, the effect on the enemy was dramatic. In a period of months, the Viet Cong there changed from the cockiest provincial force in Vietnam (Kien Hoa was the alleged birthplace of the Viet Cong and the site of the so-called capital of the movement) to a remnant of demoralized and panicky units. Things were so bad that North Vietnamese cadre and fillers (the best sign of severe erosion) began to be introduced and this was in the heartland of Viet Cong strength. The heaviest fighting was generally confined to a relatively few localities where the Viet Cong had established so-called "secret base areas" which they defended with great tenacity. If Kien Hoa is ever pacified, and it has been a dissident pirate area for some centuries, March, April and May 1969 were the beginning of the process.
On the negative side, it is of interest to note that our overall improvement was much less than one would expect. We increased our paddy strength and our effective aircraft effort appreciably. Yet our improvement in overall pressure on the enemy (measured by enemy losses) was only around 200 percent. One can only conclude that the enemy was doing his best to cancel out our improvements. In fact, by examining the history of contacts, it is apparent that the enemy had some success with his evasive tactics.
| Quarter | Contacts | Elimination Ratio | Enemy Losses Per Contact | U.S. Losses Per Contact |
|---|---|---|---|---|
| 3rd 1968 | 389 | 16.1 to 1 | 6.4 to 1 | .57 to 1 |
| 4th 1968 | 883 | 19.1 to 1 | 3.7 to 1 | .19 to 1 |
| 1st 1969 | 2723 | 31.1 to 1 | 2.6 to 1 | .07 to 1 |
| 2nd 1969 | 2137 | 54.5 to 1 | 3.8 to 1 | .07 to 1 |
Whether some tactical innovation could have kept the enemy loss figure per contact up is debatable. By sampling the battalion
[188]

RIVER PATROL
[189]
performance records, it would appear that as the overall enemy strength in an area declined, battalion skill levels stayed high but gross performance leveled off and then declined somewhat. This seems reasonable.
These results were somewhat sensitive to the overall capability of the commanders concerned. On the one hand, Major General Harris Hollis who took over the division in April 1969 was able to continue and improve on the approach; on the other hand, some lower level commanders had varying degrees of success with it.
Although the record of enemy eliminations per contact might not have been as high as one would like, this result was acceptable when one considered the 88 percent reduction in U.S. losses per contact. The dramatic reduction in the loss of American lives was the pay-off of all of our efforts.
In summary, one might conclude with reasonable confidence:
(1) A standard U.S. infantry division at full strength with adequate aviation
support could operate very efficiently in Vietnam. An increase in infantry
battalions was useful. Open terrain such as in the delta increased the relative
effect of aviation support.
(2) The Constant Pressure Concept coupled with aggressive small unit tactics
was an effective counter to enemy evasive tactics.
(3) Heavy military pressure and good pacification effort could defeat a
solidly entrenched Communist effort over a period of time.
(4) Good management and sound military judgment were essential and could be
enhanced by use of analytic techniques.
(5) There were many aspects of the war in Vietnam which resisted clearcut
analysis and assessment.
(6) Top-notch leaders (U.S. or Vietnamese, military or civilian) transcended
tactics, technique and other factors. Good leaders instinctively did the right
thing most of the time.
(7) The average U.S. soldier was individually quite superior to the Communist
soldier. With proper organization and support, this superiority was enhanced
manyfold.
[190]
page updated 19 November 2002
Return to the Table of Contents